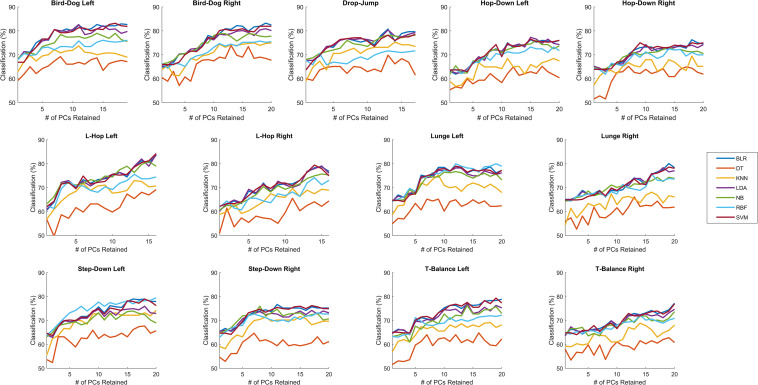
FIGURE 2.
OPT: The percent of correctly classified athletes as either elite or novice for when 1 to the total number of PCs retained were retained for binary logistic regression (BLR), decision tree (DT), linear discriminant analysis (LDA), k-nearest neighbors (kNN), naïve Bayes (NB), support vector machine with a linear kernel (SVM), and support vector machine with a radial basis function kernel (RBF) with leave-one-out validation for OPT. See number of PCs retained in Table 1.

