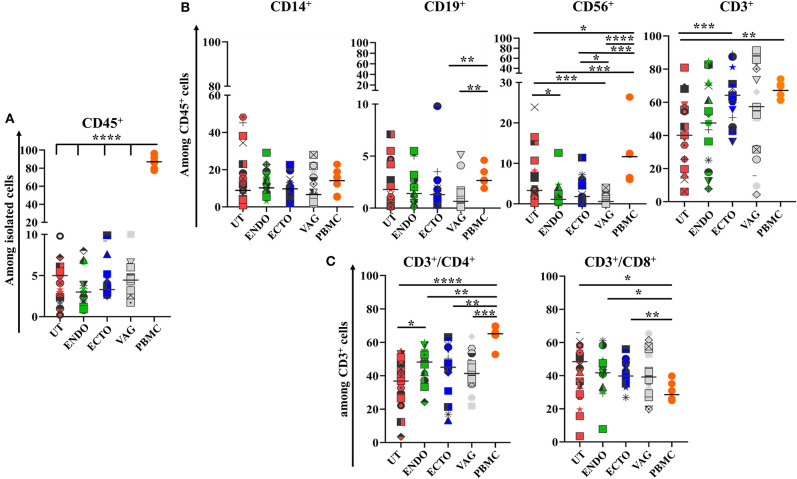
Figure 1.
Comparison of the main immune cell populations in the four compartments of the FRT and in PBMCs. (A) Percentage of CD45+ cells among total isolated cells; (B) CD14+ Antigen Presenting cells, CD19+ B cells, CD56+ Natural killer cells, and CD3+ T cells among CD45+ cells; (C) CD3+CD4+ and CD3+CD8+ T cells among CD45+ cells in the different compartments of the FRT. Uterus (UT) n = 23, Endocervix (ENDO) n = 17, Ectocervix (ECTO) n = 19, Vagina (VAG) n = 18, and PBMC n = 6. Each symbol represents a sample. The horizontal lines represent the median. Groups are compared by Mann-Whitney test *p < 0.05, **p < 0.01, ***p < 0.005, and ****p < 0.001.

