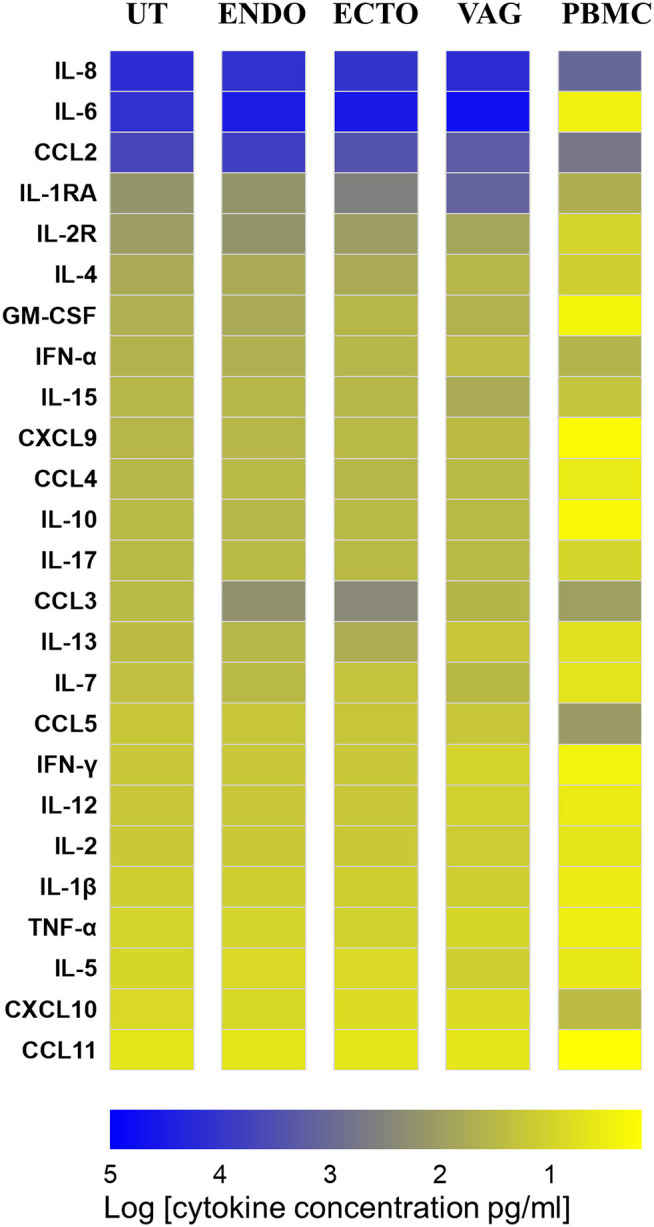
Figure 3.

Heat map representing the cytokine and chemokine concentrations in culture supernatants of total isolated cells from the FRT compartments and PBMC in unstimulated condition at 72 h. Uterus (UT) n = 7, Endocervix (ENDO) n = 6, Ectocervix (ECTO) n = 10, Vagina (VAG) n = 7, and PBMC n = 6. The markers are classified from the most to the less expressed according to the concentrations in the uterus.
