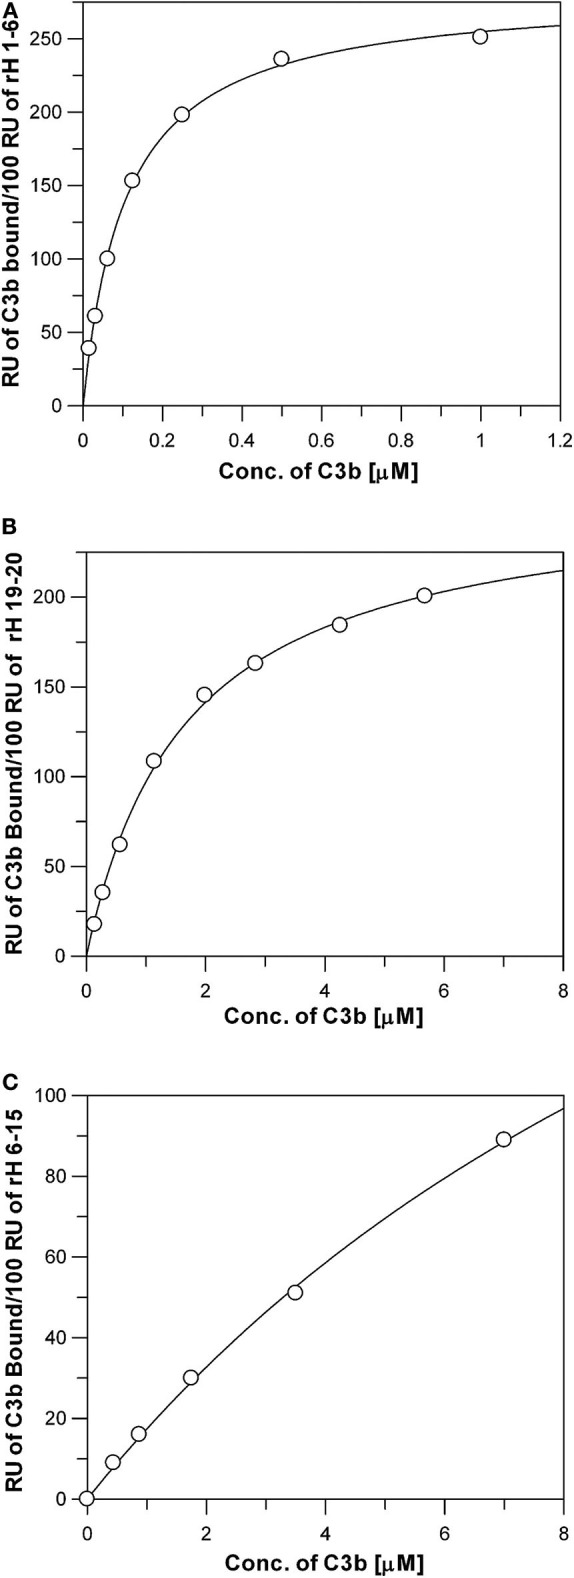
Figure 4.

Measurement of the affinity between C3b and the three C3b binding sites of Factor H. Each data point represents the equilibrium saturation level from one individual ligand binding curve from experiments like those described in Figure 3. (A) rH 1-6 bound to the Ni-NTA chip exhibited the highest affinity and required C3b concentrations from 0.014 to 0.88 μM to approach saturation. The Kd was determined by fitting the data using non-linear regression to a single site ligand binding equation (Bound = (Capacity*[Free])/(Kd + [Free])) using GraFit 5 program (Erithacus). C3b was dialyzed into HBS-P. (B) Same as (A), except purified rH 19-20 was attached to the Ni-NTA surface, (C) Same as (A), except purified rH 6-15 was attached to the Ni-NTA surface. Higher concentrations of C3b were required in (B,C) due to the lower affinity of these proteins for C3b.
