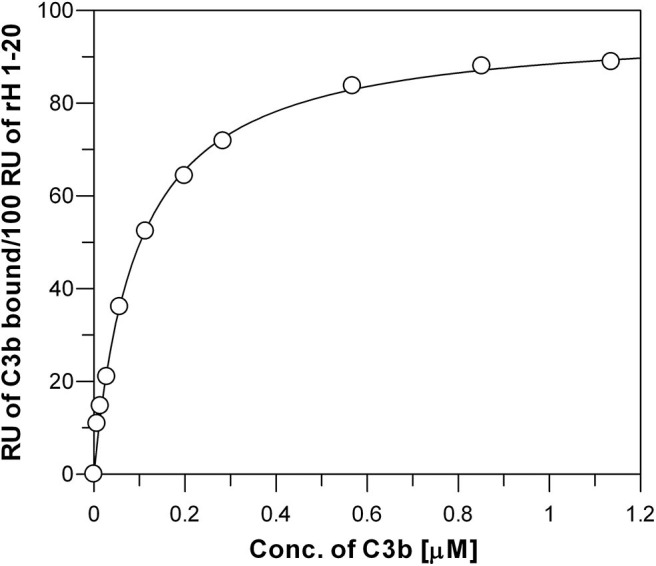
Figure 5.

Measurement of the affinity between C3b and surface-bound full-length Factor H. Each data point represents the equilibrium saturation level from one individual ligand binding curve from experiments like those described in Figure 3. Recombinantly expressed rH 1-20-6xHis was bound to Ni-NTA BIAcore chip and different concentrations of C3b in HBS-P were injected over the chip. The Kd (0.095 + 0.005 μM) was determined by fitting the data using non-linear regression to a single site ligand binding equation (Bound = (Capacity*[Free])/(Kd +[Free])) using GraFit 5 program (Erithacus).
