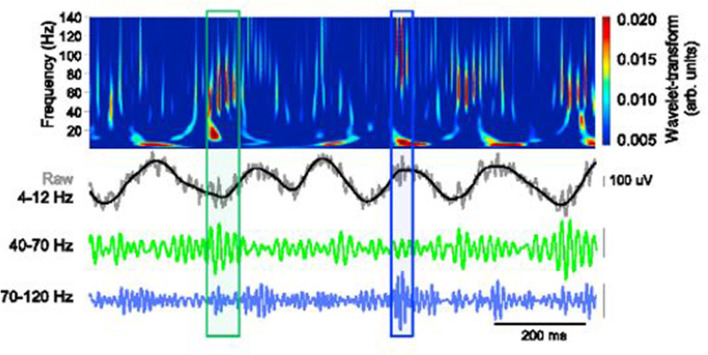
Figure 3.
Schematic depiction of theta-gamma coupling. Lower traces, slow (40–70 Hz, green) and fast (70–120 Hz, blue) gamma events, occurring at distinct phases of the theta oscillation (black). Obtained with permission from Stujenske et al. (2014).

