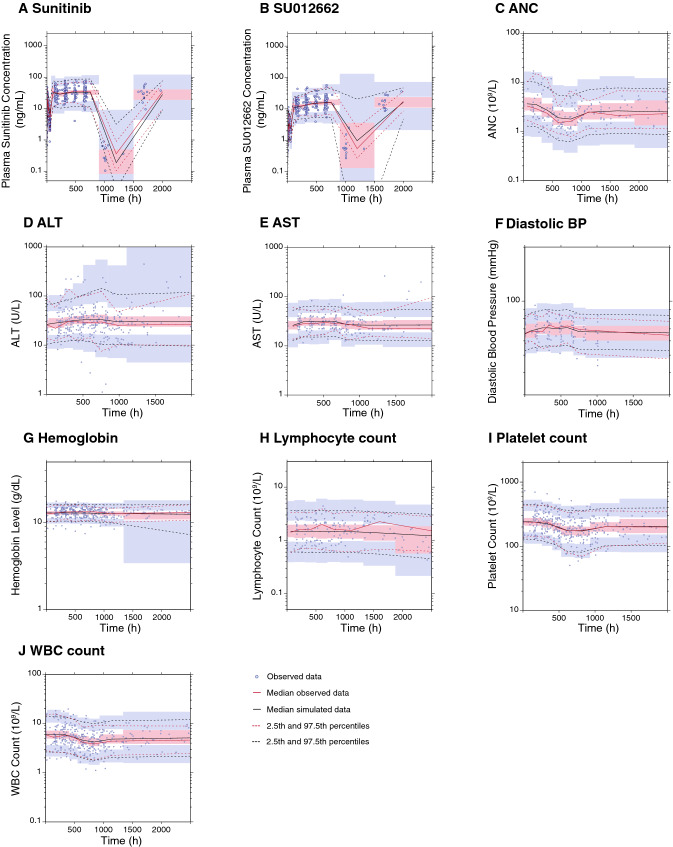
Fig. 1.
Final model prediction and variance-corrected visual predictive check plots for sunitinib and SU012662 plasma concentrations, and safety and tolerability endpoints, up to 3000 h post-dose. Visual predictive check plots for a sunitinib, b SU012662, c ANC, d ALT, e AST, f diastolic BP, g hemoglobin, h lymphocyte count, i platelet count, and j WBC count. Blue circles represent the observed data. Red lines represent the median (solid line) and 2.5th and 97.5th percentiles (dashed lines) of the observed data. Black lines represent the median (solid line) and 2.5th and 97.5th percentiles (dashed lines) of the simulated data. The 95% CIs for simulated median and each percentile are shown by pink and blue shaded areas, respectively. ALT alanine transaminase, ANC absolute neutrophil count, AST aspartate transaminase, BP blood pressure, WBC white blood cell

