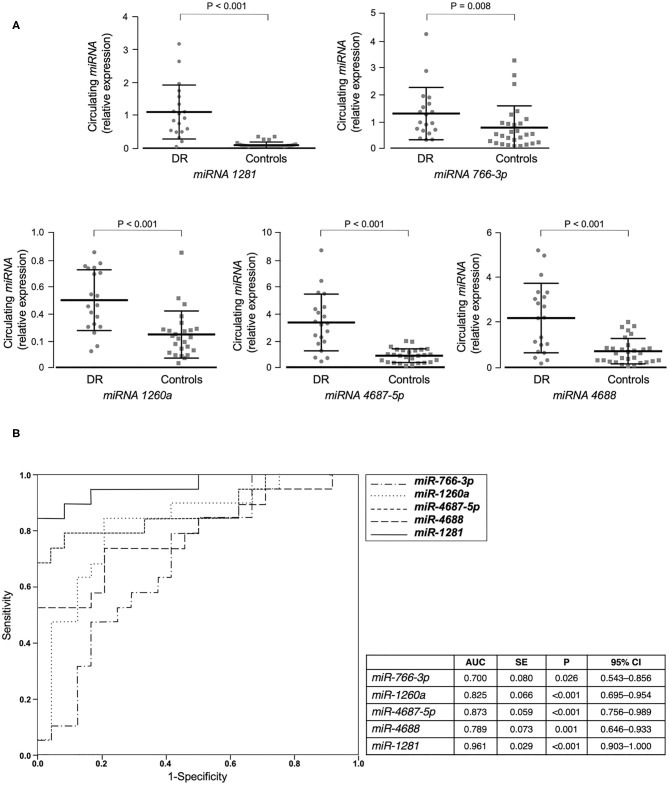
Figure 1.
miRNAs validation and miRNA's accuracy. (A) Mean ± SD of validated circulating miRNAs in the serum of patients with type 2 diabetes, with (DR, n = 20) and without (controls, n = 25) DR. Expression levels of selected miRNAs were analyzed by RT-qPCR. The relative quantification measures the concentration of a specific miRNA and is calculated as 2^(−ΔCt) for each sample (37). ΔCt values are calculated as the raw Ct value—average of raw Ct values for the selected reference miRNA (cel-miR-39-3p) in each sample. Non-parametric Mann-Whitney test was used for comparisons among two groups. (B) ROC curves of validated miRNAs for the prediction of DR. Both sensitivity and specificity are indicated. AUC, area under curve; SE, standard error; CI, confidence interval.

