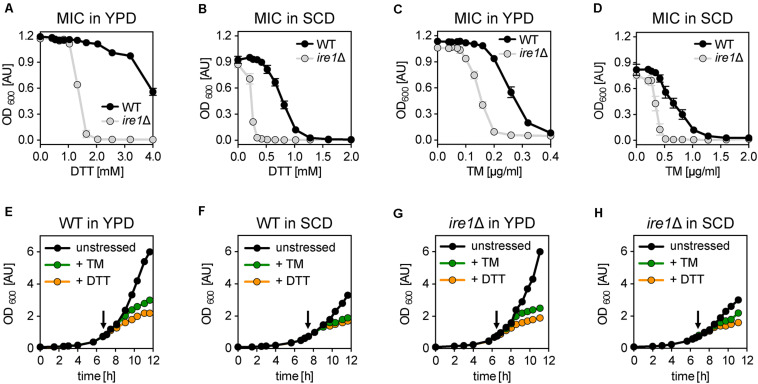
FIGURE 1.
Acute and prolonged ER stress inhibits cellular growth. (A–D) Determination of the minimal inhibitory concentration (MIC) of DTT and TM for the indicated strains. An overnight culture of the indicated strains in rich medium (YPD) was used to inoculate a main culture in either YPD (E) or SCD (F) to an OD600 of 0.2. After 6 h of cultivation to reach the exponential growth phase, a fresh culture in a 96-well plate was inoculated to an OD600 = 0.01 and adjusted to the indicated, final concentrations of either DTT or TM. After 16 h of cultivation, the OD600 as a measure for the overnight growth was plotted against the concentration of the proteotoxic drug. The data in panels (A–D) are plotted as the average ± standard deviation (SD) from three independent experiments (n = 3) with technical duplicates. (E–H) BY4741 WT and the isogenic ire1Δ strain were cultivated in either synthetic (SCD) or rich (YPD) medium at 30°C. The main cultures were inoculated to an OD600 of 0.1 from a stationary overnight culture in the respective medium. Cell proliferation is monitored by plotting the OD600 against the time of cultivation. At an OD600 of 0.80 ± 0.05 the cells were either left untreated (black) or stressed with either TM (green) or DTT (orange). An arrow indicates the time point of drug addition. DTT was used at a final concentration 8 mM and 2 mM in YPD and SCD, respectively. TM was used at a final concentration of 1.0 μg/ml and 1.5 μg/ml in YPD and SCD, respectively. The data in panels (A–D) are from a single, representative experiment. Raw data can be found in the Supplementary Data Sheet 2.

