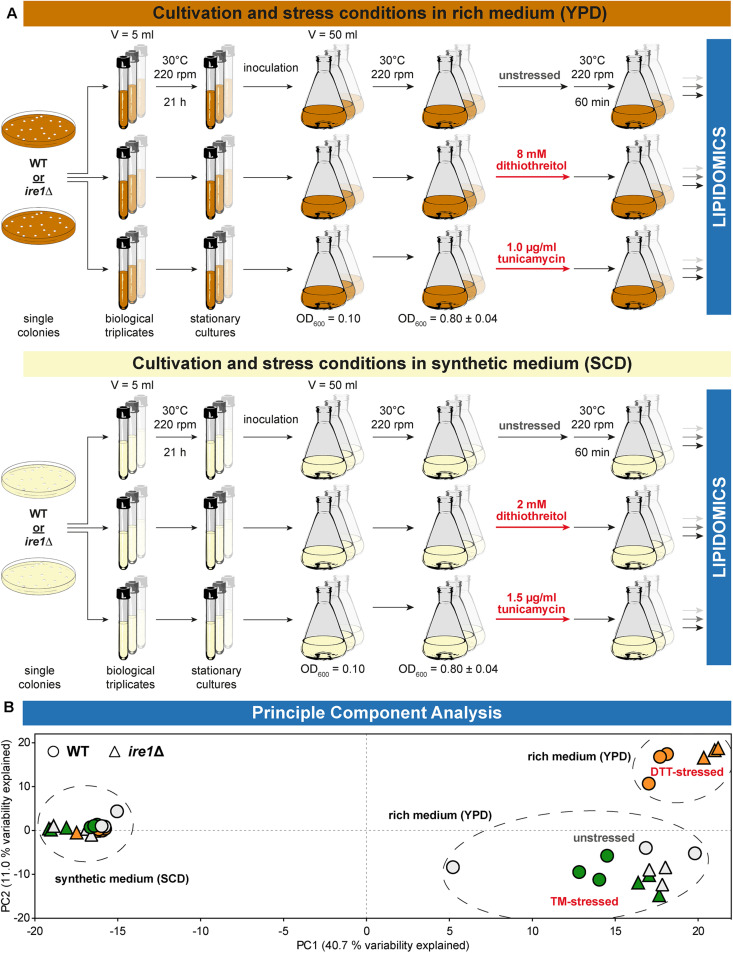
FIGURE 2.
Experimental conditions affecting lipidome variability. (A) Overview of the cultivation and stress conditions use for lipidomic analysis. (B) A two-dimensional principal component analysis (PCA) of lipid species abundances reveals the degree of variations between different cultivation and stress conditions. Data from BY4741 WT and ire1Δ cells are indicated by circles and triangles, respectively. The color of the data points indicates unstressed cells in gray and cells stressed either with DTT (orange) or TM (green). Data from stressed and unstressed cells are indicated red and gray, respectively. PCA reveals that the lipidomes from both stressed and unstressed cells cultivated in synthetic medium (SCD) are very similar. In contrast, DTT induces a characteristic remodeling of the lipidome of both WT and ire1Δ cells cultivated in rich medium (YPD).

