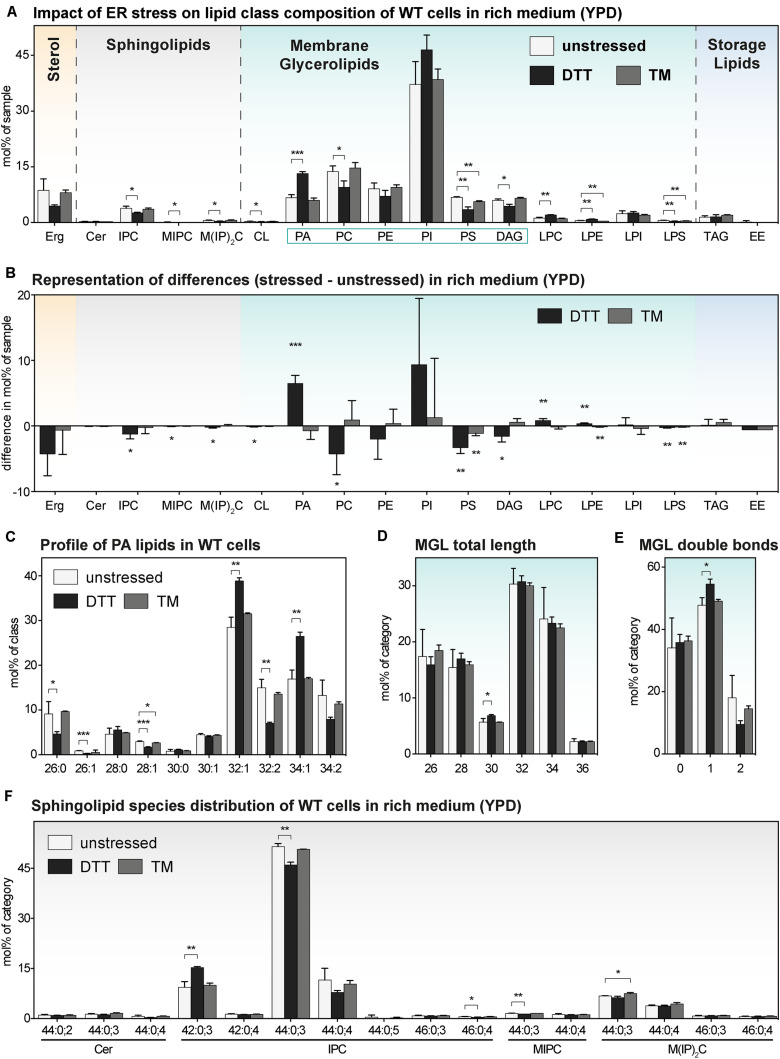
FIGURE 4.
The impact of proteotoxic stress on the lipidome of S. cerevisiae WT in rich medium. A single colony of the BY4741 WT strain was used to inoculate a preculture in rich (YPD) medium. After overnight cultivation for 21 h, a fresh culture was inoculated to an OD600 of 0.1 and then cultivated to an OD600 of 0.80 ± 0.05. The cells were then either left untreated (white bars), stressed by the addition of either with 8 mM DTT (black bars) or 1.0 μg/ml TM (gray bars). After one additional hour of cultivation, 20 OD equivalents of these cells were harvested and analyzed by lipid mass spectrometry. (A) Lipid class composition in mol% of all quantified lipids in the sample organized by lipid categories. (B) The difference in lipid class abundance in stressed minus unstressed cells highlights the impact of DTT (black) and TM (gray) on the cellular lipid composition in rich medium. The difference in abundance in mol% was calculated by subtracting the abundance in unstressed cells from the abundance in either DTT- or TM-stressed cells under consideration of error propagation. (C) Profile of PA lipids in mol% of the class. (D) Total length of lipids in a sub-category of MGLs (PA, PC, PE, PI, PS, DAG). The total length is given as the sum of carbon atoms in both fatty acyl chains in mol% of this sub-category. (E) Total number double bonds in a sub-category of MGLs (PA, PC, PE, PI, PS, DAG) is given as the sum of double bonds in both acyl chains and represented in mol% of this sub-category. (F) Profile of sphingolipids in mol% of this category. The least abundant species are omitted for clarity. Each bar represents the average ± SD from n = 3 independent experiments. Statistical significance was tested by an unpaired two-tailed t-test using GraphPad Prism, *p < 0.05, **p < 0.01, ***p < 0.001.

