Figure 11.

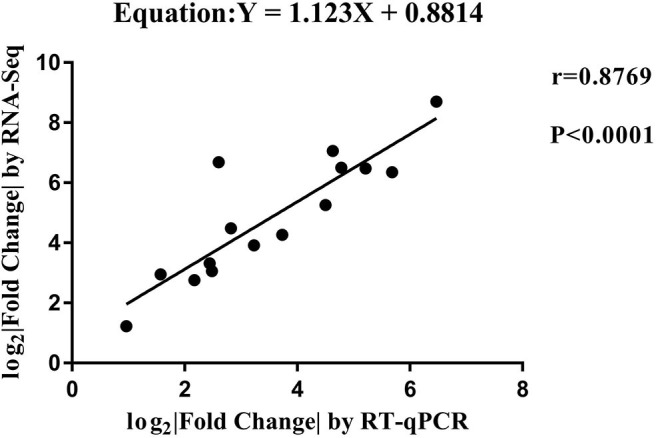
The correlation analyses of changes in lncRNA expression between RT-qPCR and RNA-Seq. The x-axis shows the Log2 (fold change) by RT-qPCR, and the y-axis is the Log2 (fold change) by RNA-Seq.

The correlation analyses of changes in lncRNA expression between RT-qPCR and RNA-Seq. The x-axis shows the Log2 (fold change) by RT-qPCR, and the y-axis is the Log2 (fold change) by RNA-Seq.