Figure 5.

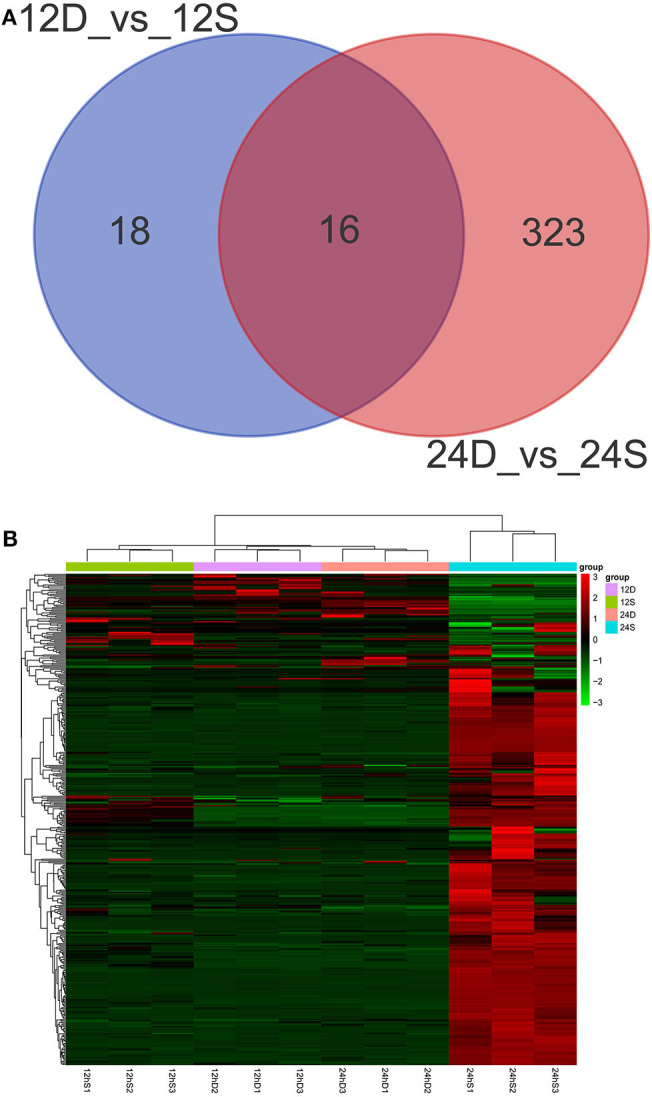
(A) Venn diagrams showing the numbers of differently expressed lncRNAs at 12 and 24 hpi. (B) The heat map showing the hierarchical clustering of altered lncRNAs. Red represents upregulation, and green represent downregulation.

(A) Venn diagrams showing the numbers of differently expressed lncRNAs at 12 and 24 hpi. (B) The heat map showing the hierarchical clustering of altered lncRNAs. Red represents upregulation, and green represent downregulation.