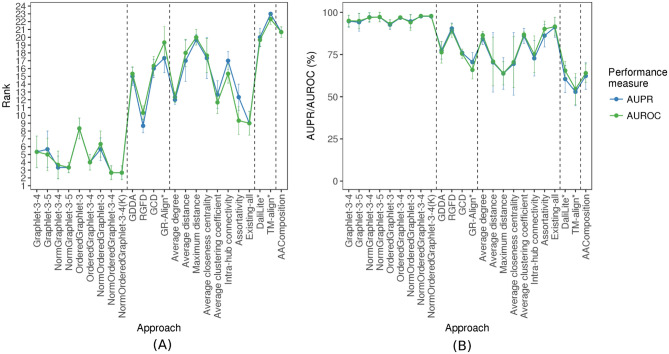
Figure 1.
The performance comparison of the 24 considered approaches, averaged over all three considered real-world PSN sets of same network sizes (that form the “equal size” PSN set group), with respect to AUPR/AUROC, in terms of: (A) the approaches’ ranks compared to one another, and (B) the approaches’ raw AUPR/AUROC values. In panel (A), for a given PSN set, the 24 approaches are ranked from the best (rank 1) to the worst (rank 24). Then, for a given approach, its three ranks (corresponding to the three PSN sets) are averaged (the average ranks are denoted by circles, and bars denote the corresponding standard deviations). So, the lower the average rank, the better the approach. In panel (B), for each approach, its three raw AUPR/AUROC values (corresponding to the three PSN sets) are averaged (the average values are denoted by circles, and bars denote the corresponding standard deviations). So, the higher the average AUPR/AUROC value, the better the approach.

