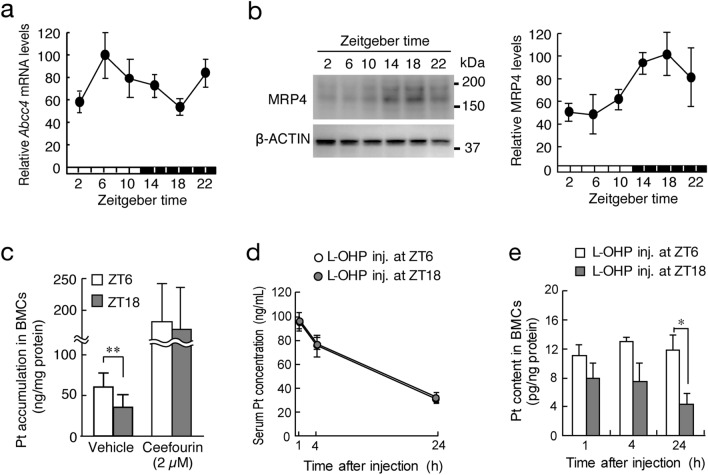
Figure 2.
Dosing time-dependent changes in L-OHP pharmacokinetics in mice. (a) Temporal mRNA expression profile of Abcc4 in BMCs of mice. The horizontal bar at the bottom indicates the light and dark cycles. Values are the mean with S.D. (n = 3). There was a significant time-dependent difference in the protein levels of MRP4 (F5,12 = 4.8254, P = 0.012, ANOVA). (b) Temporal expression profile of MRP4 in BMCs of mice. The left panel shows a representative photograph of Western blotting of MRP4. The horizontal bar at the bottom indicates the light and dark cycles. Values are the mean with S.D. (n = 3). There was a significant time-dependent difference in the protein levels of MRP4 (F5,12 = 5.626, P = 0.007, ANOVA). Full-size images of western blotting are presented in Supplementary Fig. 5. (c) Time-dependent difference in Pt accumulation in BMCs after treatment with 50 μM L-OHP in the presence or absence of 2 µM ceefourin. Values are the mean with S.D. (n = 4–6). **P < 0.01 significant difference between the two groups (F3,16 = 12.177, P < 0.001, ANOVA with Tukey–Kramer’s post-hoc test). (d) Time course of serum Pt concentration after a single dose of L-OHP (20 mg/kg, i.v.) at ZT6 or ZT18. Each point represents the mean with S.D. (n = 3). (e) Time course of Pt content in BMCs of mice after a single dose of L-OHP (20 mg/kg, i.v.) at ZT6 or ZT18. Values are the mean with S.D. (n = 3). *P < 0.05, significant difference between the two groups (t4 = 3.045, P = 0.038, unpaired t-test, two-sided).

