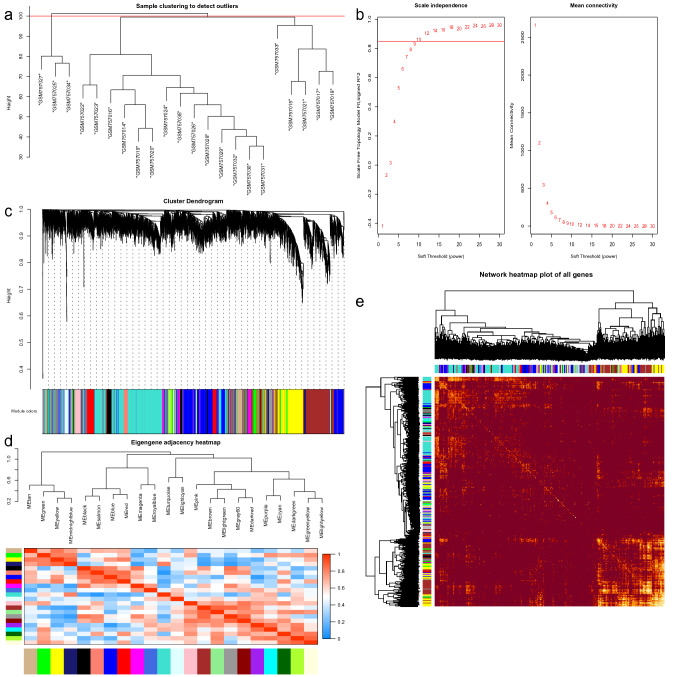
Figure 2.
WGCNA of GSE30529. (a) Sample clustering of GSE30529. (b) Analysis of soft-thresholding powers to fit the scale-free topology model and the mean connectivity of the soft-thresholding powers; 10 was chosen as the value to construct a scale-free network. (c) Dendrogram of the gene modules. The branches represent different gene modules, and each leaf represents a gene in the cluster dendrogram. (d) Clustering and heatmap of 22 gene modules. (e) Heatmap of the weighted gene coexpression correlations of all genes.

