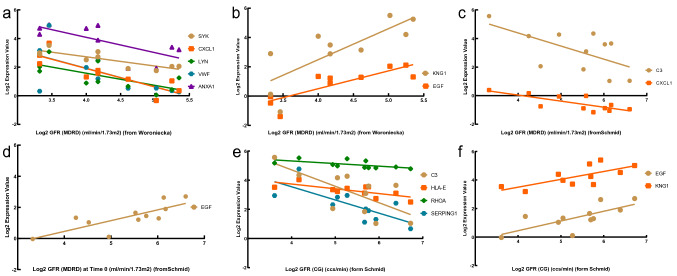
Figure 7.
Pearson correlation analyses of GFR and target genes. (a) The gene expression of SYK (p = 0.0022, r = − 0.8437), CXCL1 (p = 0.0016, r = − 0.8554), LYN (p = 0.0269, r = − 0.6911), VWF (p = 0.0452, r = − 0.6423) and ANXA1 (p = 0.0211, r = − 0.7111) was negatively related to GFR. (b) The gene expression of EGF (p = 0.0027, r = 0.8349) and KNG1 (p = 0.0073, r = 0.7838) was positively correlated with GFR. (c) The gene expression of C3 (p = 0.0459, r = − 0.6109) and CXCL1 (p = 0.0061, r = − 0.7645) was negatively correlated with GFR. (d) The gene expression of EGF (p = 0.0037, r = 0.7919) was positively related to GFR. (e) The gene expression of C3 (p = 0.0171, r = − 0.6970), HLA-E (p = 0.0132, r = − 0.7161), RHOA (p = 0.0439, r = − 0.6154) and SERPING1 (p = 0.0091, r = − 0.7409) was negatively correlated with GFR. (f) EGF (p = 0.0121, r = 0.7221) and KNG1 (p = 0.0153, r = 0.7053) were positively related to GFR.

