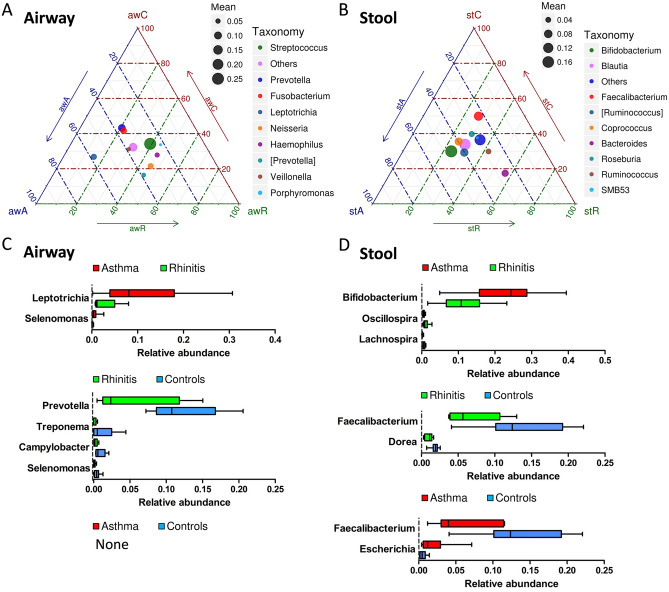
Figure 2.
OTU distribution of ternary plots and significant differential expression of bacteria at the genus level across rhinitis, asthma, and healthy controls in airway (A, C) and stool (B, D). In ternary plots, the colors represent the genera to which corresponding OTUs were assigned. The size of plotted dots corresponds to the abundance of the OTUs with respect to each disease. The position of each circle is determined by the contribution of the indicated diseases to the total abundance. OTU, operational taxonomic unit.

