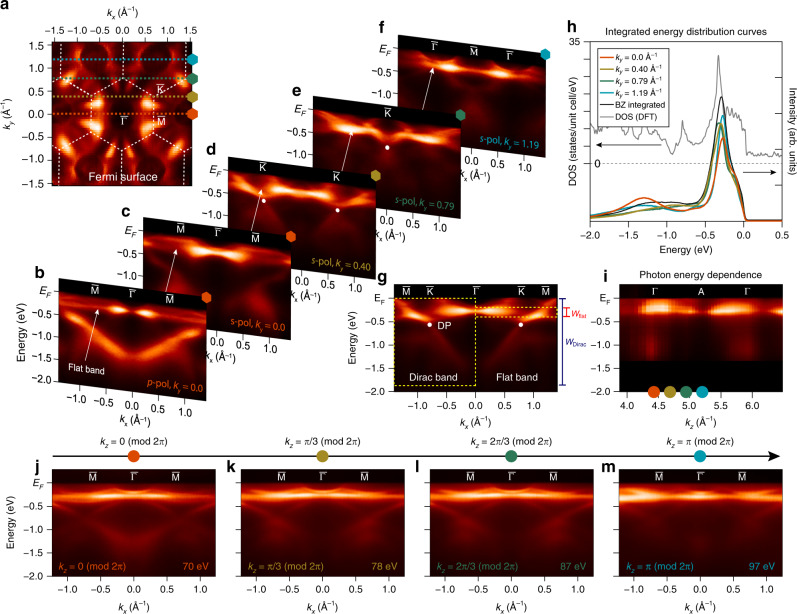
Fig. 2. Direct visualization of flat band in CoSn.
a Fermi surface of CoSn measured with 92 eV photons. Hexagonal surface Brillouin zones are marked with white dashed lines. b–f Energy–momentum dispersion of CoSn measured at ky = 0.0 Å−1 (b, c), 0.40 Å−1 (d), 0.79 Å−1 (e), and 1.19 Å−1 (f). g Energy–momentum dispersion of CoSn measured along –– high-symmetry direction. The Dirac points at are marked with white dots in (c, d, g). Red and blue scales indicate the bandwidth of the Dirac and flat bands, respectively. h Momentum-integrated energy distribution curves from spectra in c–f (orange, brown, green, and cyan lines, respectively), and from the entire first Brillouin zone (black line). Density of states curve from the density functional theory calculation of CoSn (gray line) is also overlaid. i Out-of-plane dispersion of the flat band from photon-energy-dependent ARPES experiment with the photon energy tuned from 50 to 155 eV. j–m Energy–momentum dispersion of the flat band along – high-symmetry direction measured at representative kz = 0, π/3, 2π/3, and π (mod 2π), respectively.

