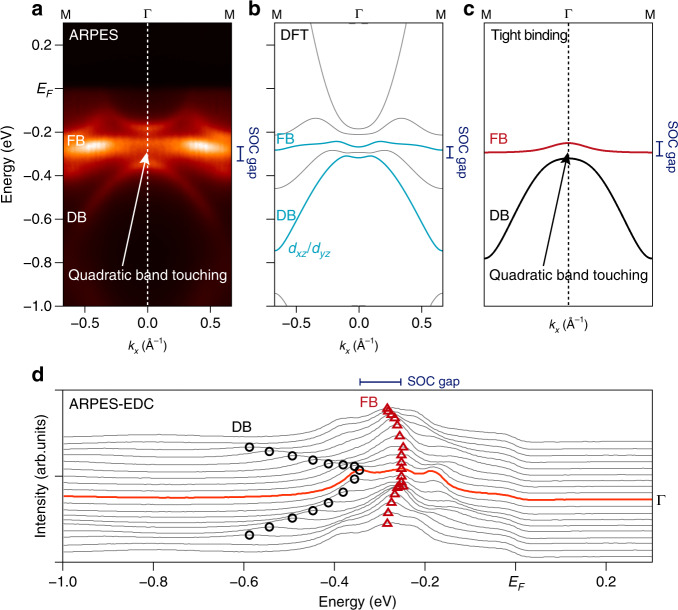
Fig. 4. Spin–orbit coupling gap opening between the Dirac and flat bands.
a High-resolution band structure of CoSn at the vicinity of the Γ point. In this image, we summed up the photoemission intensities from the first, second, and third Brillouin zone to minimize the effect of photoemission matrix element effect in intensity analysis. b, c Corresponding DFT calculation of CoSn and s-wave tight-binding calculation of monolayer kagome lattice for direct comparison with ARPES spectrum in a. In b, we highlight the Dirac and flat bands (DB and FB) with dxz/dyz orbital characters with cyan color. d Stack of energy distribution curves of the data in a. The dispersion of Dirac (flat) band with dxz/dyz orbital character is tracked with black circles (red triangles). Energy distribution curve at the Γ point (marked with red line) displays the clear separation between the flat and Dirac band peaks, highlighting the gap opening at the quadratic band touching point.

