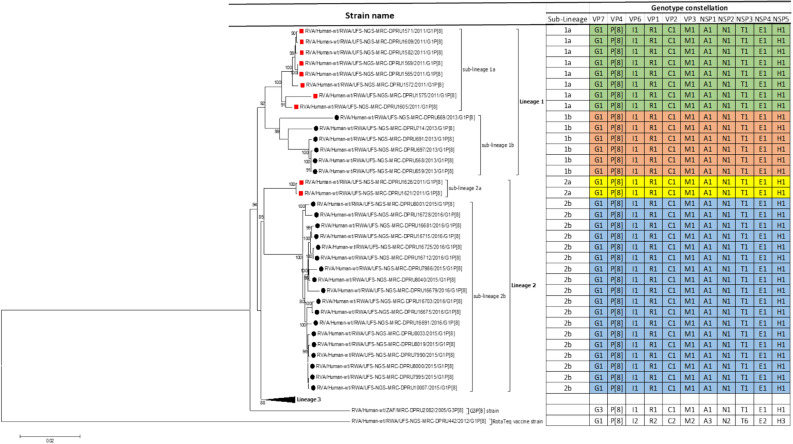
Figure 1.
Maximum likelihood phylogram revealing the genetic relatedness of the concatenated, whole-gene ORF sequences (17,492 base pairs) for the 25 post-vaccine G1P[8] and 10 pre-vaccine G1P[8] RVA study strains characterized by whole-gene analysis. The strain-specific genotype constellations are included to the right of each strain and were identified using the assembled ORF sequences. Black circle denotes post-vaccine strains, while red squares denotes pre-vaccine strains. Bootstrap values ≥ 70% are indicated at branch nodes where applicable and the scale bar indicates the number of nucleotide substitutions per site. On the table, colored in yellow and sky blue are lineage 2 pre- and post-vaccine strains belonging in sub-lineage 2a and sub-lineage 2b, respectively. Colored in green and brown are lineage 1 pre- and post-vaccine strains belonging in sub-lineage 1a and sub-lineage 1b, respectively.

