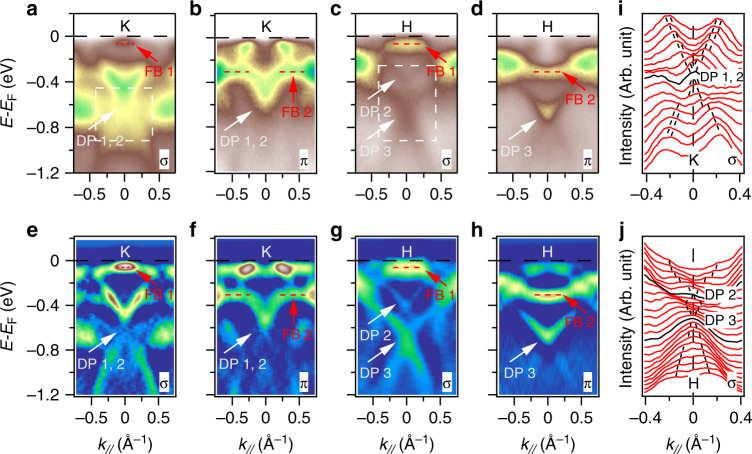
Fig. 2. The typical kagome bands.
a–d Intensity plots at the K and H points along cut1 as indicated in Fig. 1f in σ and π geometries, respectively. Dirac points (DP) and flat bands (FB) are indicated by the white and red arrows, respectively. The flat band top (FB 1) locates about −0.07 eV and the flat bottom (FB 2) locates about −0.3 eV below EF. e–h Corresponding second derivative plots of (a–d). i MDCs around the Dirac cones at the K point in σ geometry show two close Dirac cones at about −0.6 eV below EF, as indicated by the dashed square in (a). The black sticks are guides to the bands. j MDCs around the Dirac cones at the H point in σ geometry show two Dirac cones at about −0.42 and −0.68 eV below EF, respectively, as indicated by the dashed square in (c).

