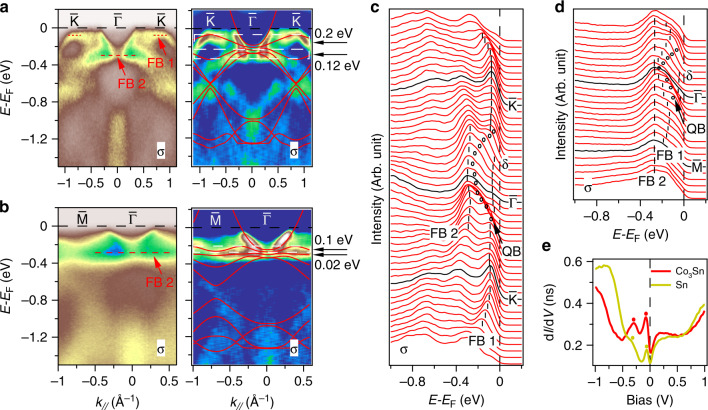
Fig. 3. The flat bands of CoSn.
a, b Intensity plots and corresponding second derivative plots along the and directions in σ geometry, respectively. Flat bands are indicated by the red dashed lines in (a, b). The red lines on the corresponding second derivative plots are DFT calculated bands renormalized by a factor of 1.5. The bandwidths of the flat bands are marked by the white squares and indicated by the black arrows. c EDCs of (a). d EDCs of (b). The flat bands (FB 1, and FB 2) and the parabolic band (QB) are indicated by the black dashed lines and open circles, respectively. e Scanning tunneling spectra (dI/dV) taken on the Co3Sn surface (red) and the Sn surface (yellow). Setpoint condition: V = 1 V, I = 100 pA.

