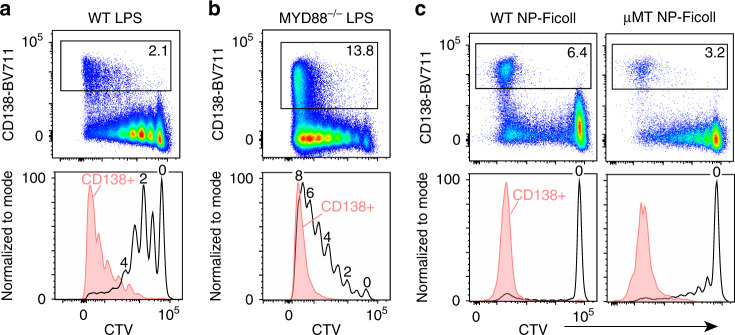
Fig. 2. T-independent type I and II antigens reveal similar division requirements.
Representative flow cytometry of CD138 versus CTV plots (top) and CTV histograms (bottom) 72 h post immune challenge for a WT hosts challenged with 50 μg of LPS; b MYD88–/– hosts challenged with 50 μg of LPS; c WT hosts (left) or μMT hosts (right) challenged with 50 μg of NP-Ficoll. Black CTV histograms represent distribution of total transferred cells, while solid red CTV histograms represent CD138+ cells. Gating and percentage of CD138+ cells are indicated in the top row. Data in (a, c) for WT hosts are representative examples from three independent experiments and six total mice each. Data in (b) are representative of two independent experiments with six total mice. Data in (c) for μMT host are representative of two independent experiments with six total mice.

