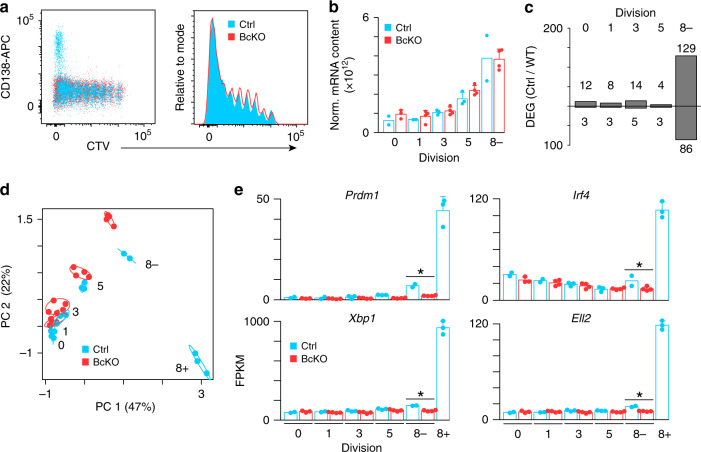
Fig. 3. BLIMP-1-dependent transcriptional reprogramming is defective in division 8.
(a) Representative flow cytometry analysis of Prdm1fl/fl (Ctrl) and Cd19Cre/+Prdm1fl/fl (BcKO) B cells 72 h after LPS inoculation. (b) ERCC normalized total mRNA content for samples from the indicated divisions sorted from (a). c Bar plot showing the number of differentially expressed genes (DEG) for the indicated division between Ctrl and BcKO B cells. d Principal component analysis of samples from (b) using all DEG. The location of cells in each division is labeled. Circles denote 99% confidence intervals for samples in each division. e Bar plot of expression of select genes from divisions 0, 1, 3, 5, 8– and for Ctrl 8+. FPKM fragments per kilobase per million. Data in (b, e) represent mean ± SD and asterisk indicates statistical significance (FDR < 0.05) as determined by edgeR59. Data were derived from 2 to 4 individual mice as follows: Ctrl division 0 (n = 2), 1 (n = 2), 3 (n = 3), 5 (n = 3), 8− (n = 2), and 8+ (n = 3); BcKO division 0 (n = 3), 1 (n = 4), 3 (n = 4), 5 (n = 4), 8− (n = 4). Source data are provided as a Source Data file.

