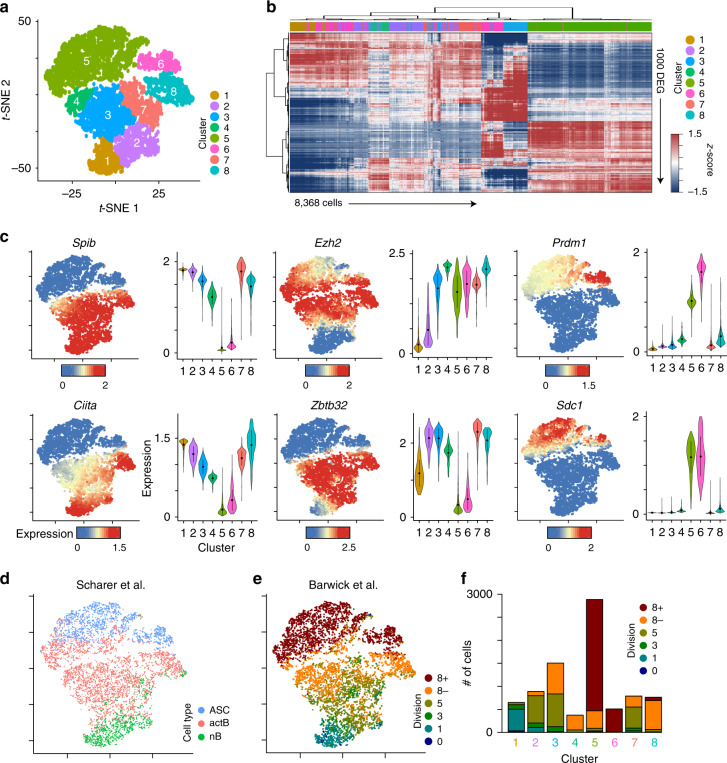
Fig. 4. scRNA-seq reveals a continuum of heterogeneous LPS-responding B cells.
at-SNE plot of 8368 WT cells responding to LPS showing eight distinct clusters of cells. b Heatmap showing hierarchical clustering of the top 1000 differentially expressed genes (DEG) between cells in each of the eight clusters from (a). Data represent z-score normalized MAGIC expression values. ct-SNE plot (left) from (a) and violin plots (right) for each cluster showing the MAGIC gene expression data for the indicated gene. For violin plots, the dots represent the mean and lines represent first and third quartile ranges. dt-SNE plot from (a) showing the annotation of each cell with naïve B cells (nB) and ex vivo differentiated activated B cells (actB) and ASC from Scharer et al.14. et-SNE plot from (a) showing the annotation of each cell with division sorted LPS-responding B cells from Barwick et al.16. f Bar plot quantitating the number of cells from each cluster annotated to specific divisions in (e). Data represent combined cells from two independent mice. Source data are provided as a Source Data file.

