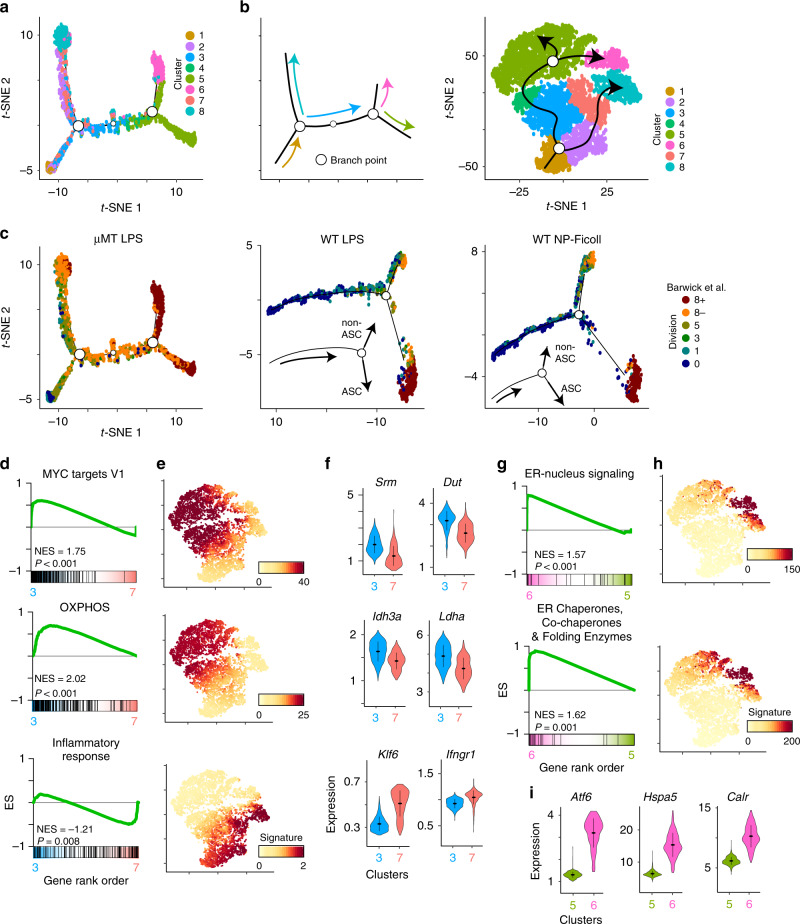
Fig. 5. Pseudotime identifies divergent activated B-cell differentiation trajectories.
at-SNE plot of pseudotime ordered cells from Fig. 4a showing the location of cells from each cluster. Open circles denote pseudotime branch points. b Schematic showing the pseudotime order of cells from (a) (left) and from the t-SNE plot from Fig. 4a (right). c Pseudotime t-SNE plot from (a) (left) or from scRNA-seq data on adoptively transferred cells responding to LPS (middle) or NP-Ficoll (right) in WT hosts showing cells annotated based on division sorted LPS-responding B cells from Barwick et al.16 (see Fig. 4e and Supplementary Fig. 1). Circles denote pseudotime branch points. d GSEA of the indicated datasets comparing the transcriptional profile between cells in clusters 3 and 7. et-SNE plot showing mean MAGIC expression levels for all Leading Edge genes from the GSEA gene set in (d). f Violin plots showing MAGIC expression levels for cells in clusters 3 and 7 for the indicated genes. Genes were chosen from the adjacent GSEA gene set from (d). Within each violin plot, the dots represent mean MAGIC expression levels and lines represent first and third quartile ranges. g GSEA of the indicated datasets comparing the transcriptional profile of cells in clusters 5 and 6. ht-SNE plot showing mean MAGIC expression levels for all Leading Edge genes from the adjacent GSEA gene set in (g). The ER chaperones, co-chaperones, and folding enzymes gene set were described previously34. i Violin plots of select genes representative of gene sets in (g). WT LPS and WT NP-Ficoll scRNA-seq data in (c) represent combined cells from two independent mice. Significance for GSEA was calculated by permutation testing with P < 0.001 indicating the gene set was enriched over all 1000 permutations. Source data are provided as a Source Data file.

