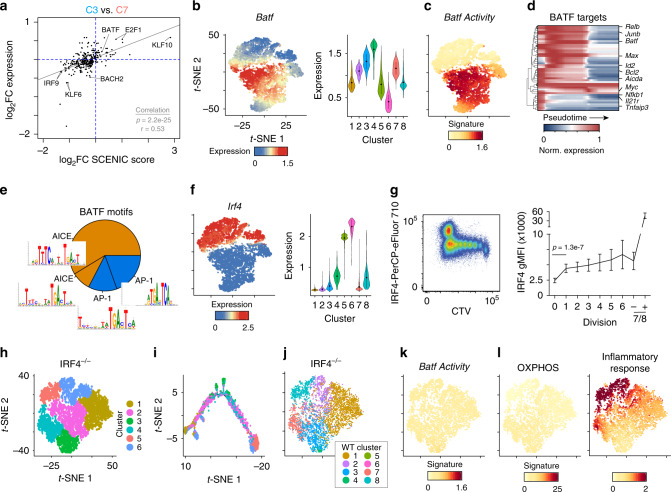
Fig. 6. IRF4 is critical for establishing the ASC-destined branch transcriptional program.
a Scatter plot showing the expression log2 fold change (log2FC) versus the log2FC in SCENIC activity score between cluster 3 versus 7 for each transcription factor. Gray line represents linear regression with significance determined by one-way ANOVA. Pearson’s r correlation is indicated. bt-SNE plot (left) from Fig. 4a and violin plot (right) showing the MAGIC gene expression data for the indicated gene. For violin plots, dots represent mean and lines represent first and third quartile ranges. ct-SNE plot showing mean MAGIC expression levels for BATF target genes determined by SCENIC. d Heatmap showing expression of 46 BATF target genes along pseudotime in WT cells. For each gene, the mean MAGIC expression level is normalized to the maximal value. e Pie chart representing the percentage of BATF target genes containing either the canonical AP-1 or composite IRF:AP-1 (AICE) motif. ft-SNE plot (left) and violin plot (right) showing the MAGIC gene expression data for the indicated gene. For violin plots, the dots represent mean and lines represent first and third quartile ranges. g Representative flow cytometry (left) and geometric mean fluorescence intensity at each cell division (right) for intracellular staining of IRF4 levels versus CTV in LPS-responding B cells 72 h after LPS inoculation. Division 7/8 cells are subdivided into CD138 negative (−) and positive (+). Data represent mean ± SD and statistical significance determined by two-tailed Student’s t test. Data represent two independent experiments of nine mice. ht-SNE plot of 6903 Cd19Cre/+Irf4fl/fl (IRF4–/–) cells responding to LPS showing the location of six distinct cell clusters. Data represent combined cells from two independent mice. it-SNE plot of pseudotime ordered cells from (h) showing the location of cells from each cluster. jt-SNE plot from (h) showing the annotation of each cell with a WT cluster from Fig. 4a. kt-SNE plot from (h) showing mean MAGIC expression levels for BATF target genes as in (c). lt-SNE plot from (h) showing mean MAGIC expression for Leading Edge genes from the indicated gene set (see Fig. 5e). Source data are provided as a Source Data file.

