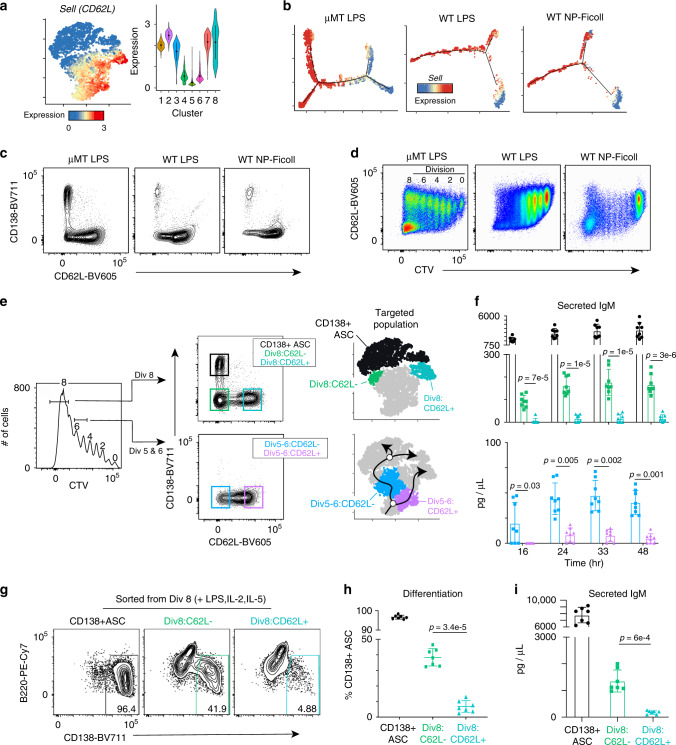
Fig. 7. Loss of CD62L (L-selectin) delineates cells on the ASC-destined branch.
at-SNE plot (left) from Fig. 4a and violin plot (right) for each cluster showing the MAGIC gene expression data for Sell (CD62L) in WT cells. For violin plots, the dots represent mean and lines represent first and third quartile ranges. bSell expression projected along pseudotime for each scRNA-seq dataset (see Fig. 5c). c Representative flow cytometry plot of CD138 versus CD62L for adoptively transferred cells from μMT hosts challenged with 50 μg of LPS (left), WT hosts challenged with 50 μg of LPS (middle), or WT hosts challenged with 50 μg of NP-Ficoll (right). All plots are 72 h after challenge. d Representative flow cytometry plot of CD62L versus CTV for each adoptive transfer setup described in (c). The division number is indicated in the left panel. e Representative FACS strategy for isolating ASC in clusters 5 and 6 (CD62L–CD138+ cells), ASC-destined cells in cluster 4 (div8:CD62L–CD138–), non-ASC-destined cells in cluster 8 (div8:CD62L+CD138–), ASC-destined cells in cluster 3 (CD62L–CD138–), and non-ASC-destined cells in cluster 2 (CD62L+CD138–). Cells were gated on division 5, 6, or 8 and then separated by CD138 and CD62L expression 72 h post LPS challenge. f IgM titers in culture over time for the indicated samples from division 8 (top) and divisions 5 and 6 (bottom). g Representative flow cytometry plot of B220 versus CD138 expression after 16 h of culture with LPS, IL-2, and IL-5 for the indicated samples. Percent of CD138+ ASC is indicated. h Percent of CD138+ cells and i IgM titers in culture for each sample. Data in (f, h, i) represent mean ± SD. Statistical significance in (f, h, i) was determined by paired two-tailed Student’s t tests. Data in (f) represent two independent experiments with a total of eight mice; data in (g–i) represent two independent experiments with a total of seven mice. Source data are provided as a Source Data file.

