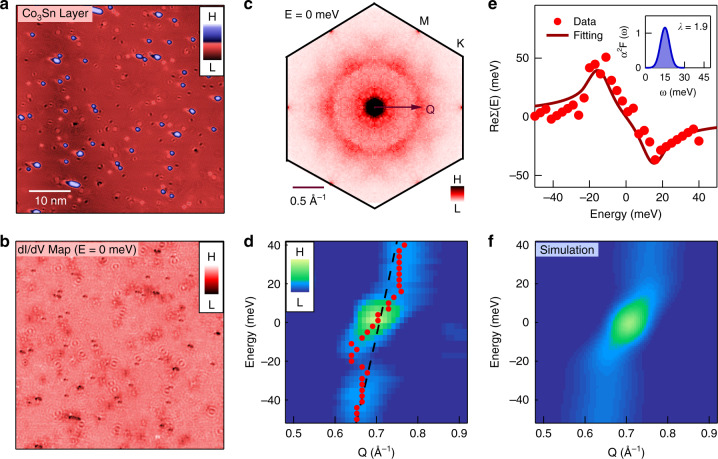
Fig. 3. Bosonic mode induced many-body kink in the kagome dispersion.
a A topographic image of Co3Sn layer. b Corresponding differential conductance map taking at E = 0 meV. c QPI data of the Co3Sn surface. Data have been sixfold symmetrized to enhance the signal to noise ratio. Due to intraband scattering nature, Q = 2k. d QPI dispersion along the Γ-M direction showing a pronounced kink. The dots mark the QPI peak positions while the dashed line illustrates the bare band based on first-principles calculations. e The real part of the electron self-energy. The dots are extracted from the energy difference between the renormalized QPI dispersion and the bare QPI dispersion. The line is calculated based on a Gaussian-like Eliashberg function with coupling strength λ = 1.9 shown in the inset. f Simulated QPI dispersion showing the kink based on the same Eliashberg function.

