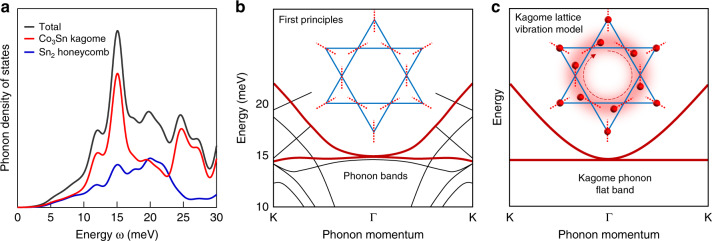
Fig. 4. Kagome flat-band origin of the bosonic mode.
a Calculated layer-resolved phonon density of states, showing a pronounced peak at 15 meV arising from the Co3Sn kagome layer. b Calculated phonon band structure, showing a flat-band at 15 meV. The inset shows the calculated atomic displacements for the kagome lattice associated with the phonon flat-band, where the dotted lines denote the atomic vibration directions. c Phonon band structure for the kagome lattice vibration model. The inset shows the collective atomic vibrations associated with the phonon flat-band.

