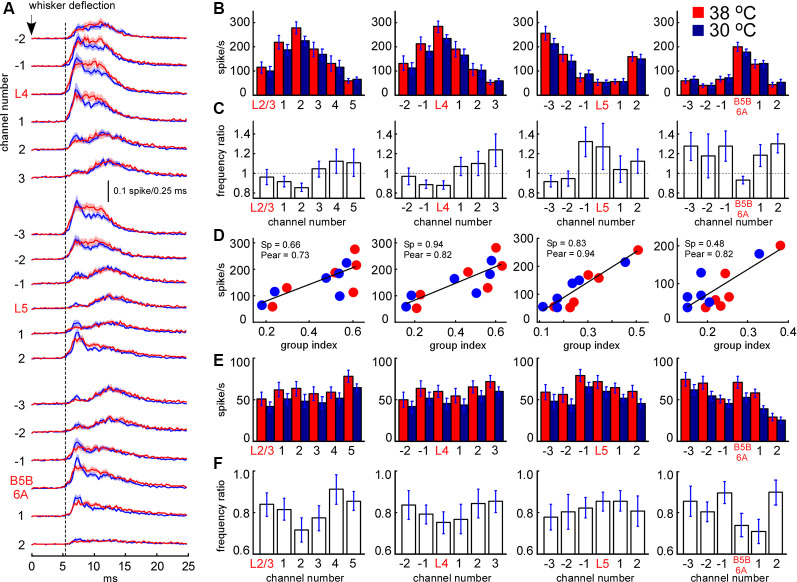
Figure 8.
Sensory-evoked MUA rate in control and during cortical cooling. (A) Grand average peristimulus spike histograms (evoked during active states) in control (red) and during cortical cooling (blue). Note the increased peak firing with cooling. (B) Early sensory-evoked MUA firing rate (evoked during active states) from different recording channels of the silicon probe in control (shown with red) and during cortical cooling (blue). (C) Early sensory-evoked MUA frequency ratio (cooling/control) averaged around cortical layers (n = 22). (D) Early sensory-evoked MUA firing rate plotted against the MUA grouping index shown in Figure 7C. Cortical layers with a high grouping index (spontaneous activity) responded to the whisker stimulation with higher firing rates. Linear fitting is shown with black lines. Spearman and Pearson correlation coefficient is indicated as Sp and Pear respectively. (E) Late sensory-evoked MUA firing rate (evoked during active states) from different recording channels of the silicon probe averaged around cortical layers (representative channels) in control and during cortical cooling. (F) Late sensory-evoked MUA frequency ratio (cooling/control) averaged around the detected cortical layers.

