Figure 3.

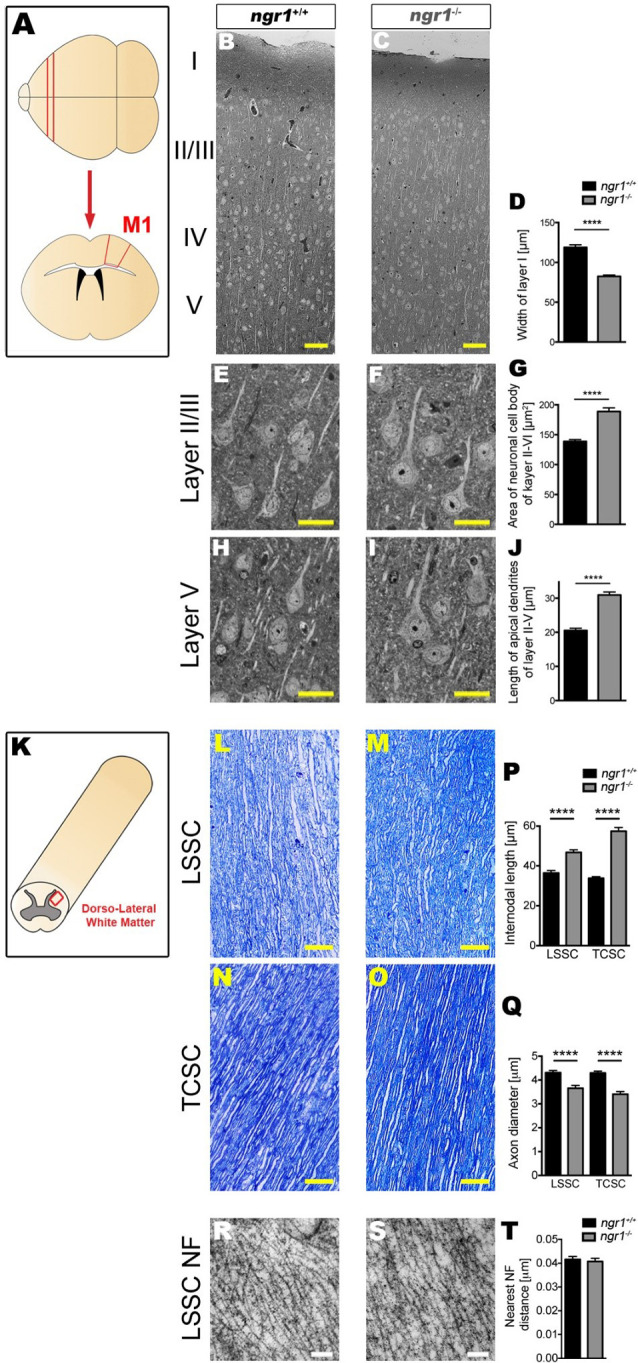
Altered neuronal architecture within the frontal cortex and altered axonal and myelin architecture in the spinal cord of ngr1−/− mice. For detailed methods please see the Supplementary Information. (A) Illustration of the M1 frontal motor cortex region from which samples were imaged. (B–J) Semi-thin sections from the M1 regions of ngr1+/+ and ngr1−/− mice revealed a different neuronal morphology. (B,C) Light microscopic images of the M1 cortical layer from layer I to V in ngr1+/+ and ngr1−/− mice (scale bar = 50 μm). (D) Measurements of the molecular layer width; layer I, was significantly shorter in ngr1−/− compared to ngr1+/+ mice. (E–I) Representative high magnification images of pyramidal neurons from (E,F) Layer II/III (H,I) and layer V. Both (G) area and (J) length measurements obtained for the apical dendrites of neurons within the cortical layers II-V were found to be increased in ngr1−/− compared to ngr1+/+ mice. (K) Illustration of the dorsolateral white matter region of the spinal cord from which samples were imaged. Representative image showing how internodal length and axonal diameters measured is shown below. (K–Q) Toluidine blue-stained semi-thin (1 μm) dorsolateral white matter sections of lumbosacral (LSSC) and thoracic-cervical (TCSC) spinal cords (red rectangle region) of both adult ngr1+/+ and ngr1−/− mice (scale bars = 50 μm). (P) Internodes of ngr1−/− were significantly longer in both LSSC and TCSC when compared with ngr1+/+. (Q) Axonal diameters of ngr1−/− mice were significantly smaller in both LSSC and TCSC when compared with ngr1+/+ mice. (R,S) Ultra-thin (100 nm) electron micrograph longitudinal sections of LSSC from adult (R) ngr1+/+ and (S) ngr1−/− mice showing normal ultra-structure of neurofilaments in both genotypes (scale bar = 100 nm). (T) Quantification of nearest neighbor distances between neurofilaments in myelinated axons of descending fiber tracts in ngr1+/+ and ngr1−/− LSSC (****P < 0.0001, n = 8 for both genotypes).
