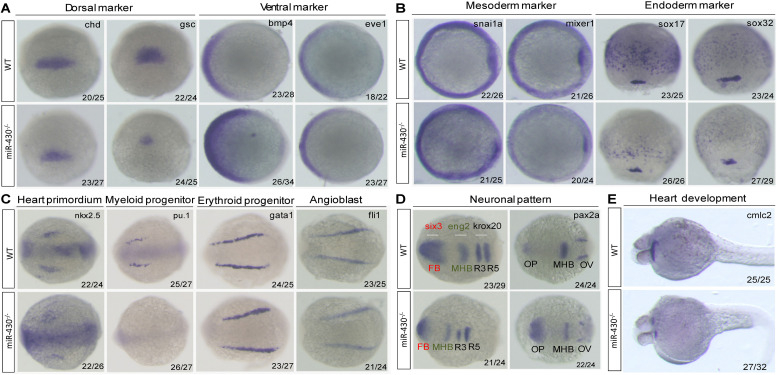
FIGURE 3.
Marker gene analysis. Marker gene expression of the WT and miR-430–/– mutant was analyzed at shield stage (A), 75% epiboly (B), 6-somite (C,D), and 36 hpf (E). Marker genes of axis formation (A), germ layer formation (B), organ progenitor formation, (C) neuronal pattern (D), and heart formation (E) were analyzed in the miR-430–/– mutants. The ratios of the observed phenotypes were indicated. FB, forebrain; MHB, midbrain hindbrain boundary; OV, otic vesicle; OP, optic placode; R3, rhombomere 3; R5, rhombomere 5.

