Figure 2.

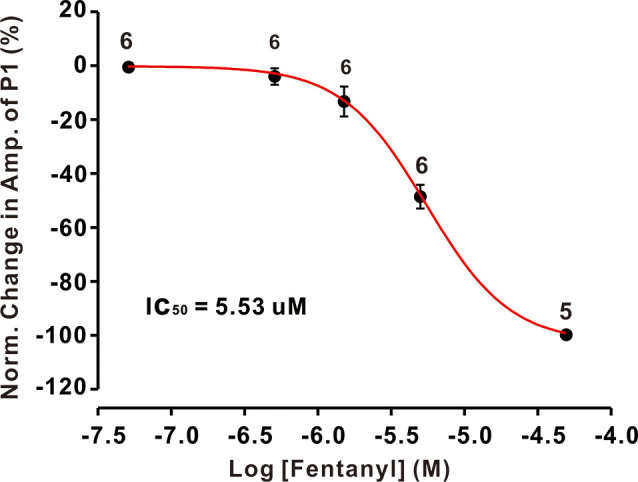
The concentration-response curve shows the fentanyl-induced decrease in the amplitude of P1. The IC50 value obtained from the curve was 5.53 μM. The number of PCs examined at each concentration is indicated near the respective bars.

The concentration-response curve shows the fentanyl-induced decrease in the amplitude of P1. The IC50 value obtained from the curve was 5.53 μM. The number of PCs examined at each concentration is indicated near the respective bars.