
Figure 3.
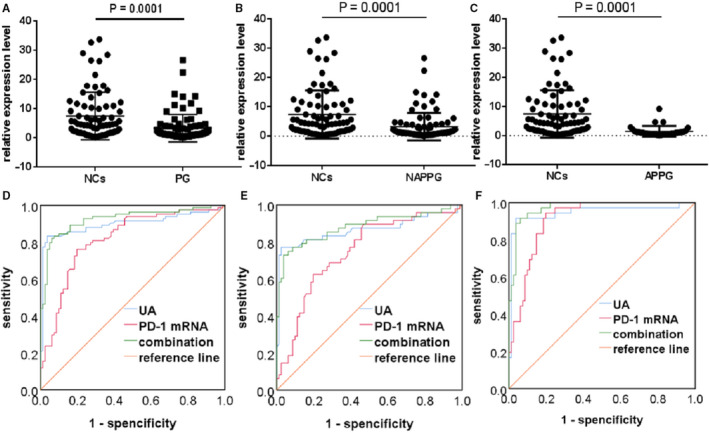
Diagnostic performance of PD‐1 mRNA in different stages of PG compared to healthy controls. A‐C, Forest scatterplot: The qRT‐PCR assay was performed to verify the expression levels of PD‐1 mRNA in the NCs group, PG group, NAPPG group and APPG group. D‐F, ROC curve analysis of SUA, PD‐1 mRNA and the combination of both biomarkers. PG: NAPPG + APPG