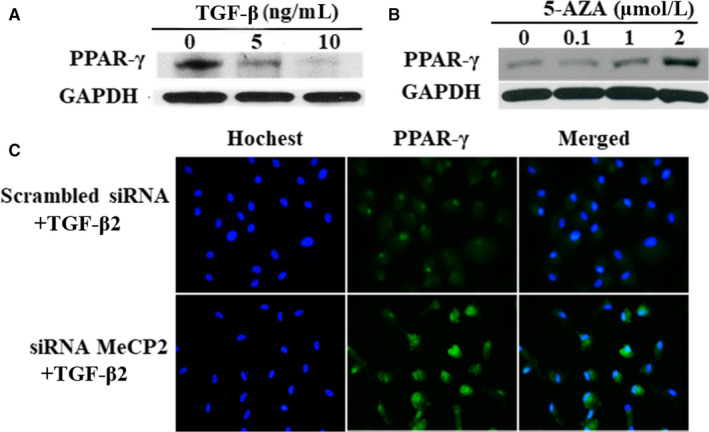
FIGURE 7.

The effect of the expression of PPAR‐γ by TGF‐β (A), 5‐AZA (B) and siRNA MeCP2 (C) in the RPE cells. TGF‐β inhibits the expression of PPAR‐γ, and the strongest inhibition can be seen at the concentration of 10ng/ml of TGF‐β(A); however, PPAR‐γ expression is up‐regulated by the treatment of 5‐AZA up to 2µM(B); knocking down MeCP2 using siRNA results in an increased expression of PPAR‐γ as shown by immunocytochemistry (C)
