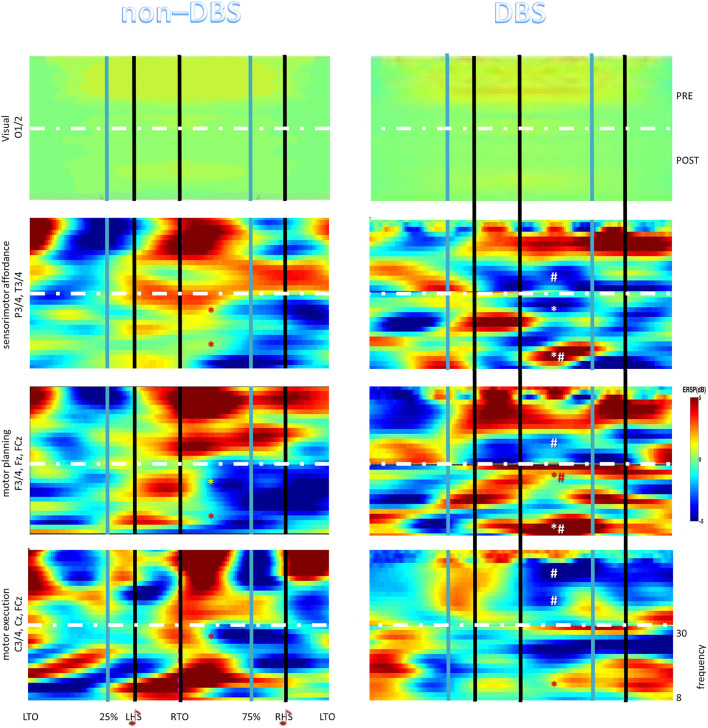
Figure 1.
The Event–Related Spectral Perturbation (ERSP) plots relative to the full gait cycle showing the average changes in spectral power during the gait cycle for the different electrode groups (brain areas). The horizontal axis is the percentage of gait cycle (as we performed a time–warping analysis) referred to the heel strikes (HS) and the toe offs (TO). *denotes post-pre significant changes (p < 0.001), #between-group post-pre significant differences (p < 0.001).

