FIGURE 3.

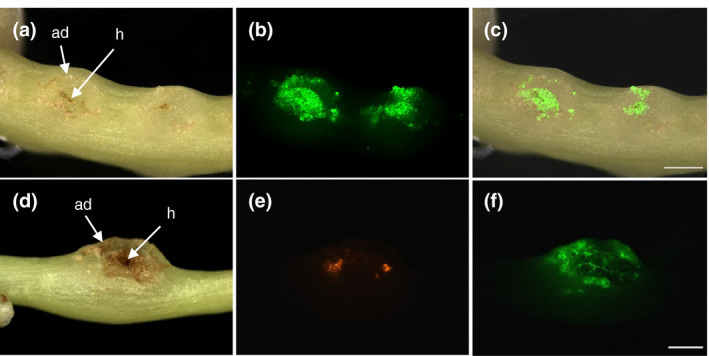
Uptake of 5‐Carboxyfluorescein‐diacetate (CFDA) into adhesive disks of C. reflexa. (a–c) Green CFDA fluorescence is shown in a shoot segment containing two developing infection sites. A superimposition of the images from (a) and (b) is shown in (c). (d–f) CFDA uptake into an adhesive disk containing dsRed‐expressing cells. Darkfield images (left column) and fluorescence images (middle column and lower right image) are shown. Adhesive disks (ad) and haustoria (h) are indicated. Scale bars are 1,000 µm
