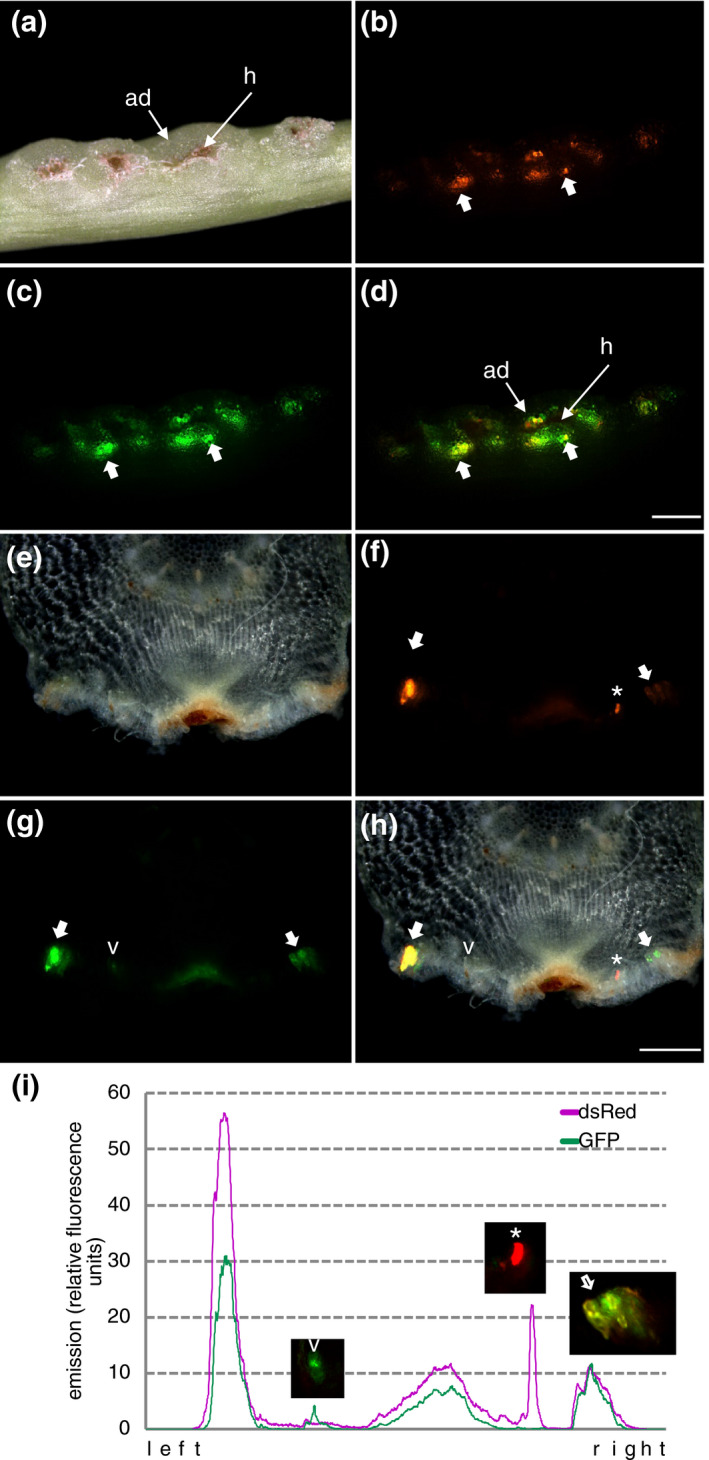
FIGURE 5.

Cotransformation of different reporter proteins in C. reflexa adhesive disks. DsRed was introduced with A. rhizogenes while GFP was introduced with A. tumefaciens. (a–d) Side view of intact stem with darkfield (a), red fluorescence (b), and green fluorescence (c) images. Figure (d) shows a superimposed image of the two fluorescence images with thick arrows pointing at spots where both reporter proteins coincide (yellow color due to overlay). The scale bar measures 1,000 µm. (e–h) Cross section through a transformed infection site with darkfield (e), red fluorescence (f), and green fluorescence (g) images. Figure (h) shows a superimposed image of all three images. The scale bar measures 500 µm. The asterisk and the arrowhead indicate cells that are transformed with only one reporter protein. The thick arrow indicates cells were both reporter proteins coincide. (i) Intensity scan performed on the two single fluorescent images with the purple line representing the dsRed fluorescence and the green line representing the GFP fluorescence
