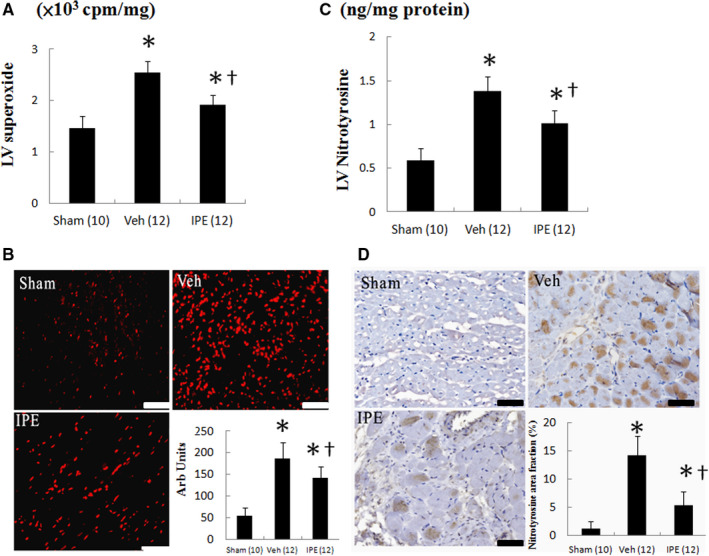
FIGURE 2.

A, Myocardial superoxide by chemiluminescence, B, dihydroethidium (DHE) staining and quantitative analysis, C, nitrotyrosine by ELISA and D, nitrotyrosine immunoreactive staining and quantitative analysis from the remote zone. Myocardial DHE (red fluorescent) and nitrotyrosine (brown) staining showed more intense signals (nuclear position for DHE and cytoplasm for nitrotyrosine) after MI. The number of animals in each group is indicated in parentheses. Bar = 50 μm. *P < .05 compared with sham; † P < .05 compared with the vehicle‐treated infarcted group
