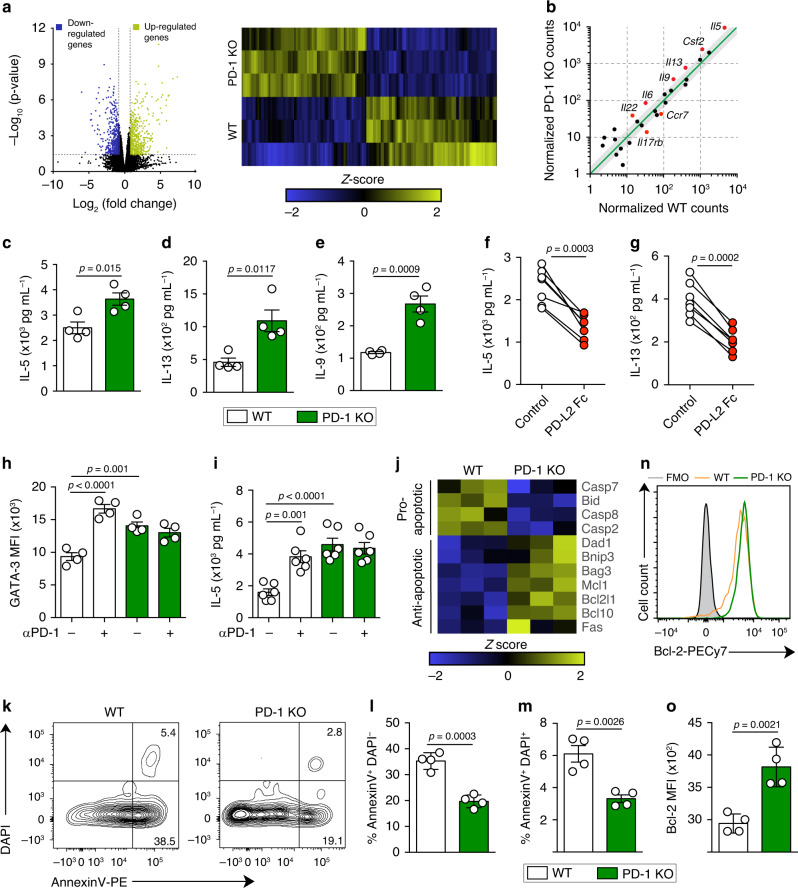
Fig. 2. PD-1 axis controls cytokine production by aILC2s and decreases their survival.
a–g; j–o ILC2s were sorted from WT and PD-1 KO mice after three intranasal challenges with 0.5 μg of rm-IL-33. Sorted cells were incubated with rm-IL-2 (10 ng mL−1) and rm-IL-7 (10 ng mL−1) for 24 h. a Volcano plot comparison (left) and heatmap representation (right) of total differentially regulated genes. Gene−specific analysis (GSA) algorithm was used to test for differential expression of genes (p-value < 0.05, n = 3). b Differentially expressed cytokine and cytokine receptor genes plotted as the normalized counts in WT compared to PD-1 KO aILC2s. Gray area indicates region of 1.5-fold-change cutoff or lower change in expression; n = 3. c Levels of IL-5, d IL-13, and e IL-9 quantified using LEGENDplex bead-based immunoassay; n = 4. f Levels of IL-5 and g IL-13 secreted by aILC2s in the presence of PD-L2 Fc or the isotype; n = 7. h, i ILC2s were sorted from naïve mice (nILC2s), cultured and stimulated in vitro with rm-IL-33 (20 ng mL−1) for 48 h. PD-1 blocking antibody (αPD-1; 10 μg mL−1) or isotype control were added in some conditions. h GATA-3 quantification presented as MFI in WT and PD-1 KO ILC2s; n = 4. i Levels of IL-5 quantified in ILC2 supernatants; n = 6. j Heatmap representation of significantly regulated pro- and anti-apoptotic genes. GSA algorithm was used to test for differential expression of genes (p-value < 0.05, n = 3). k Representative flow cytometry plots of AnnexinV DAPI staining and l corresponding quantification presented as the percentage of apoptotic and m dead ILC2s; n = 4. n Representative flow cytometry plot of Bcl-2 staining and o corresponding quantification presented as MFI in WT and PD-1 KO aILC2s; n = 4. Data are representative of three independent experiments and are presented as means ± SEM (two-tailed Student’s t test or one-way ANOVA).

