
Figure 1.
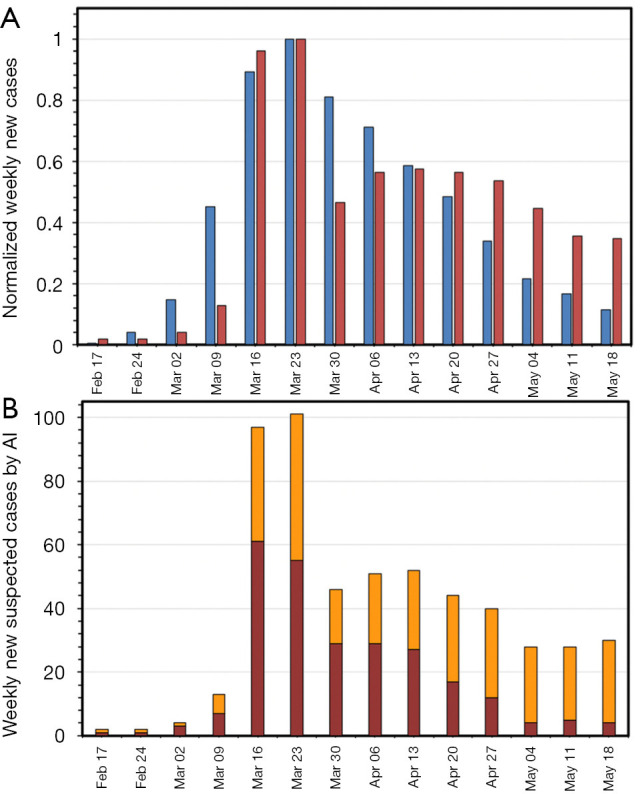
Weekly new suspected cases identified by AI between February 17th and May 24th in Italy. (A) Comparison of weekly new suspected cases identified by AI (red bars) with national data (blue bars). Data are normalized to the number at the zenith for both distributions (number of cases at the zenith is 38,551 for national data and 101 for AI server data); (B) risk stratification of the number of weekly new suspected cases identified by AI into “High Risk” (red bars) and “Low Risk” (orange bars). AI, artificial intelligence.