
Fig. 4.
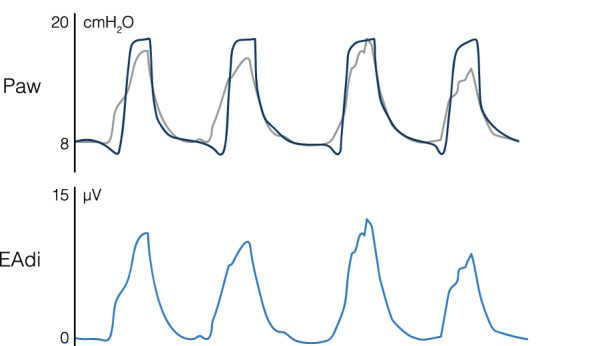
Example of the neurally adjusted ventilatory assist (NAVA) preview during pressure support ventilation (inspiratory assist of 10 cmH2O above a positive end-expiratory pressure of 8 cmH2O). The grey curve shows a “preview” of the estimated airway pressure (Paw) that would exist if the patient was ventilated in NAVA mode. The shape of this Paw curve resembles the diaphragm electrical activity (EAdi) curve (i.e., proportionality). The amount of assist depends on the EAdi amplitude and the selected NAVA level (0.8 cmH2O/µV for this example)