Figure 2.

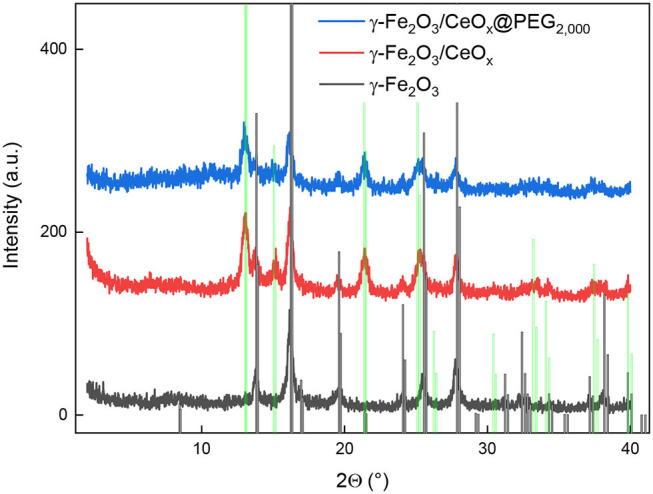
Diffraction pattern of γ-Fe2O3 (black), γ-Fe2O3/CeOx (red), and γ-Fe2O3/CeOx@PEG2,000 nanoparticles (blue) compared to that of γ-Fe2O3 and CeO2 from the Crystallography Open Database (vertical black and green lines, respectively).

Diffraction pattern of γ-Fe2O3 (black), γ-Fe2O3/CeOx (red), and γ-Fe2O3/CeOx@PEG2,000 nanoparticles (blue) compared to that of γ-Fe2O3 and CeO2 from the Crystallography Open Database (vertical black and green lines, respectively).