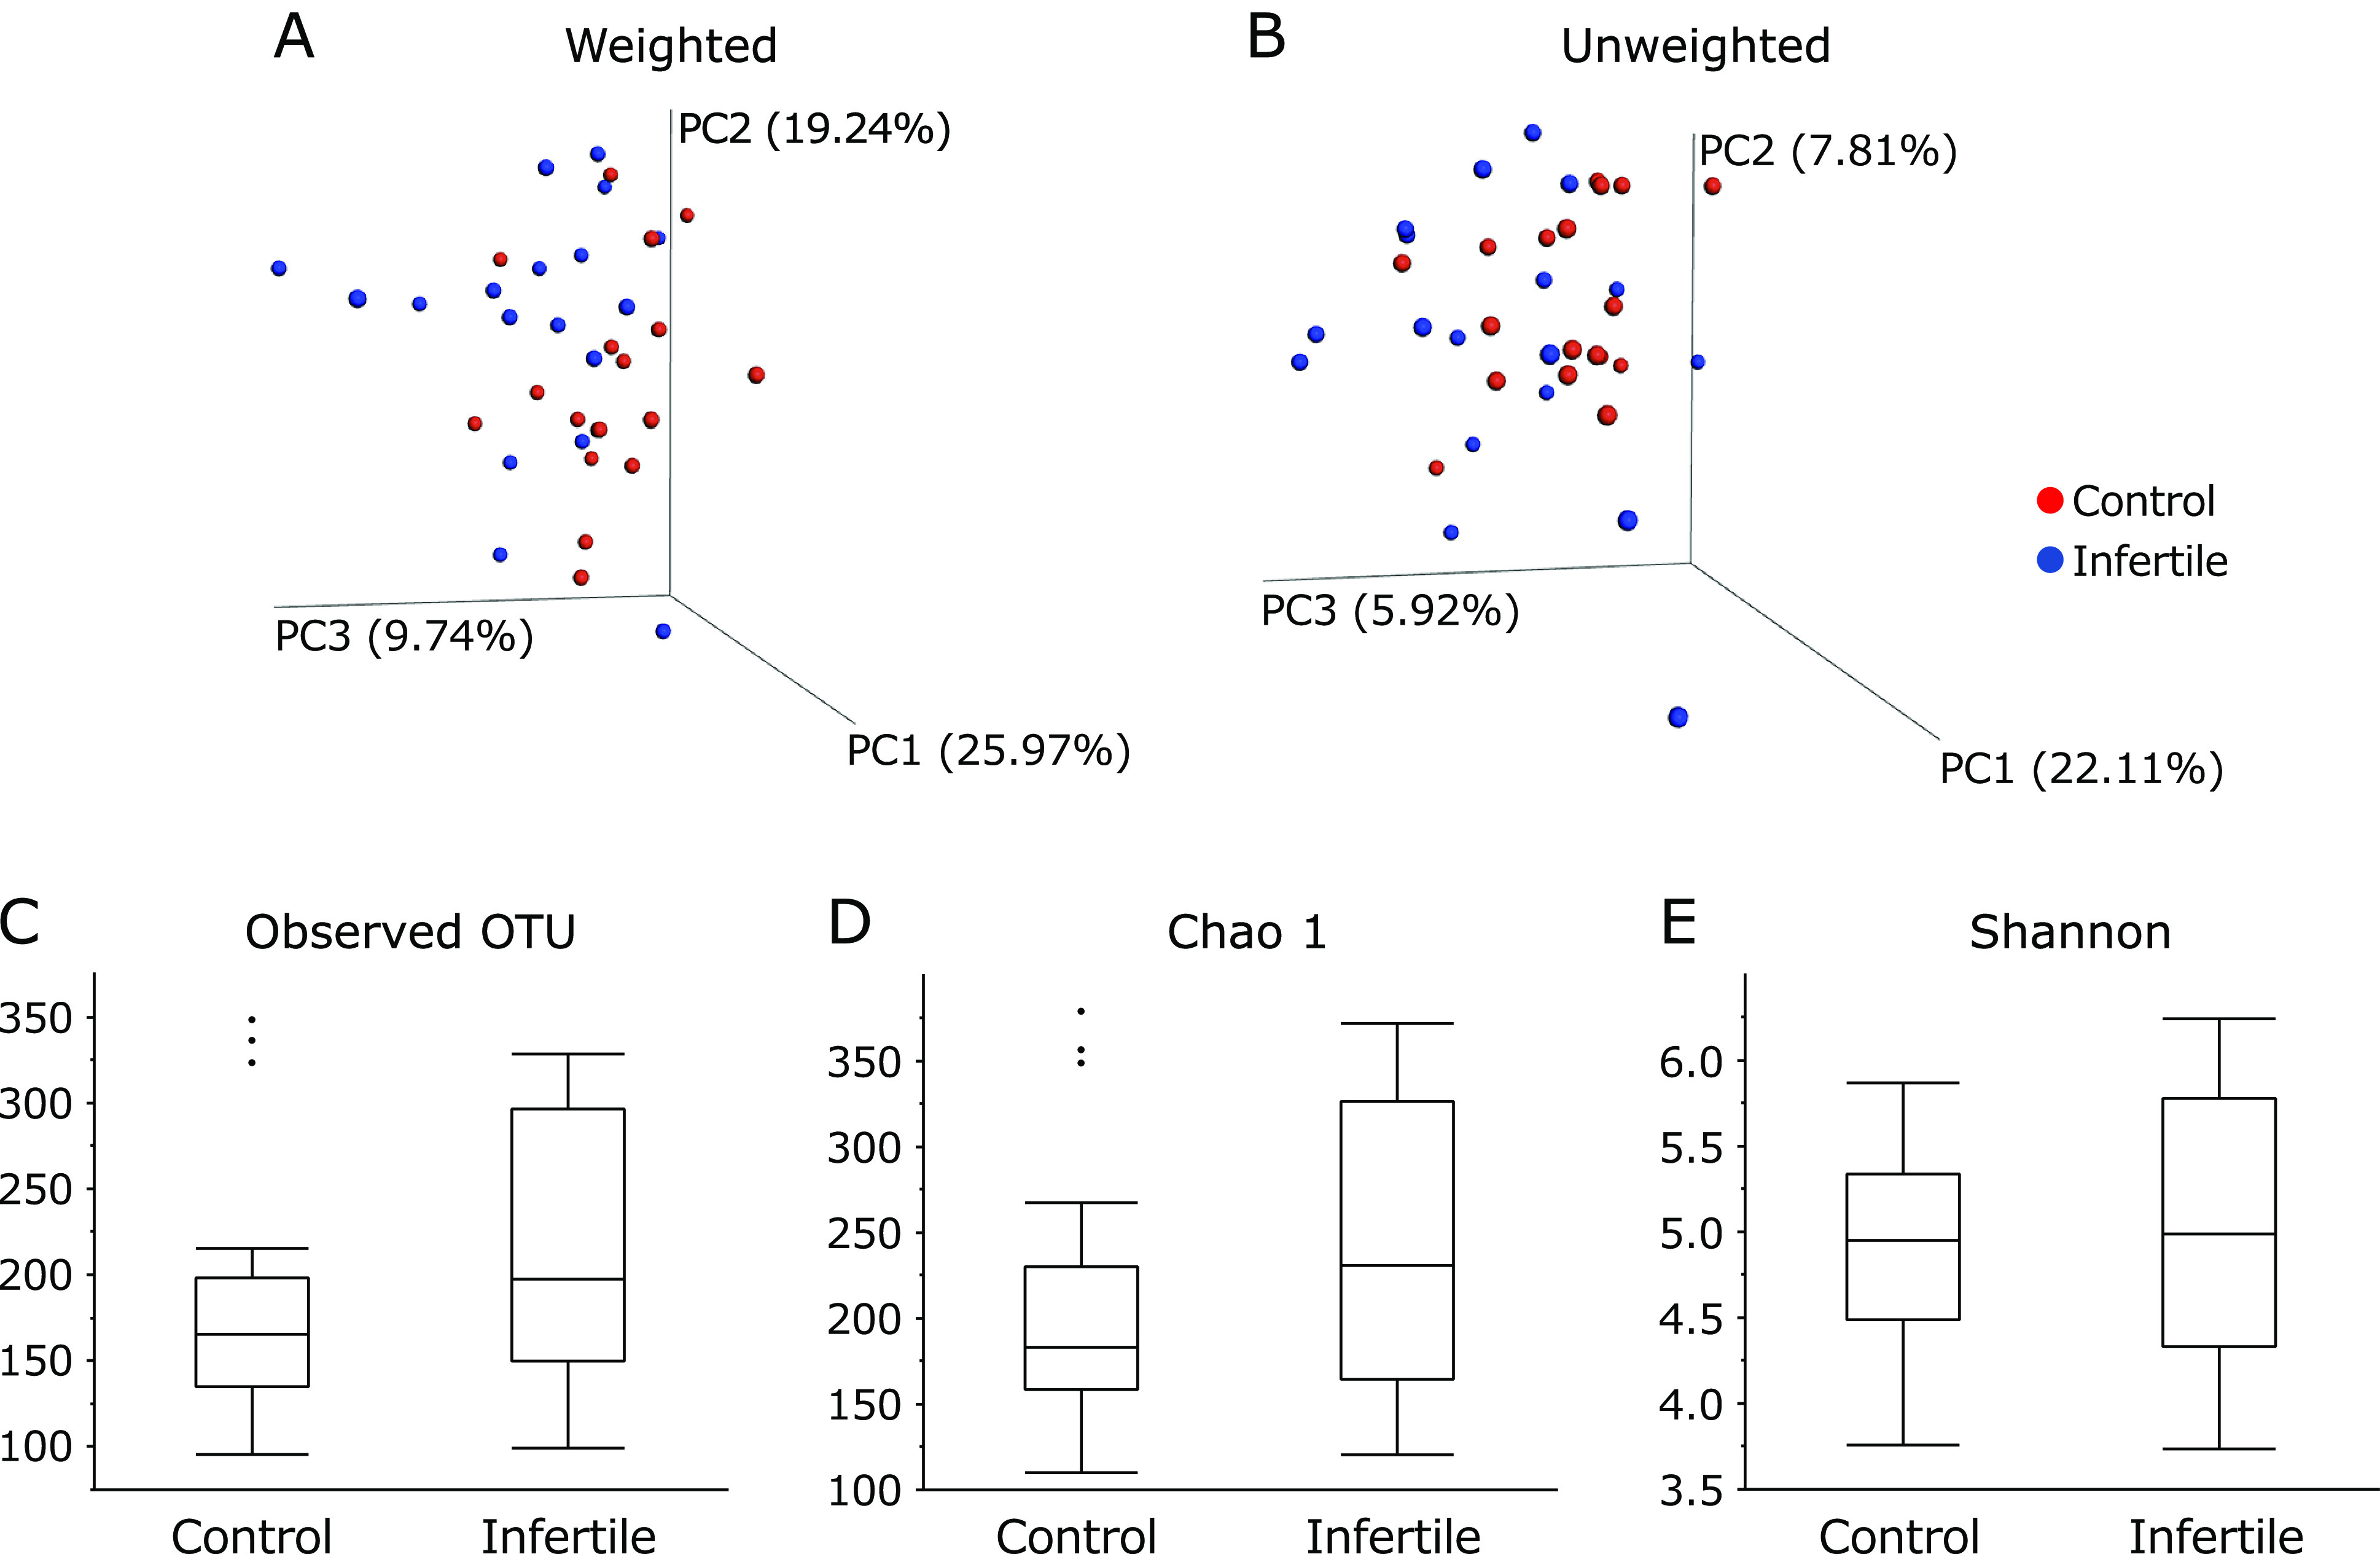
Fig. 1.

Principal coordinate analysis (PCoA) plots of control subjects vs patients with infertility and the α-diversity indices between the two groups. Distances were calculated with weighted (A) and unweighted (B) UniFrac distances. (C) observed species, (D) the Chao 1 index (OUT richness estimation), (E) the Shannon index (OUT evenness estimation).
