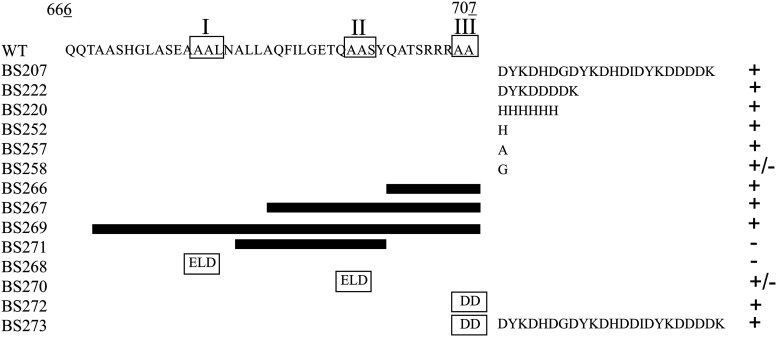
FIG 1.
Mutational analysis of the C-terminal region of McpU and its effect on stability. Depicted is a diagram of the C-terminal region of McpU (amino acids [aa] 666 to 707) and the extensions, deletions, and substitutions made in its native chromosomal locus (Table 1). Boxes in the wild-type sequence and the respective mutants indicate specific motifs and their substitutions, respectively. Black bars represent extent of deletions. The column on the right symbolizes McpU abundance relative to that in the wild type; +, increase, −, decrease; +/−, no change.

