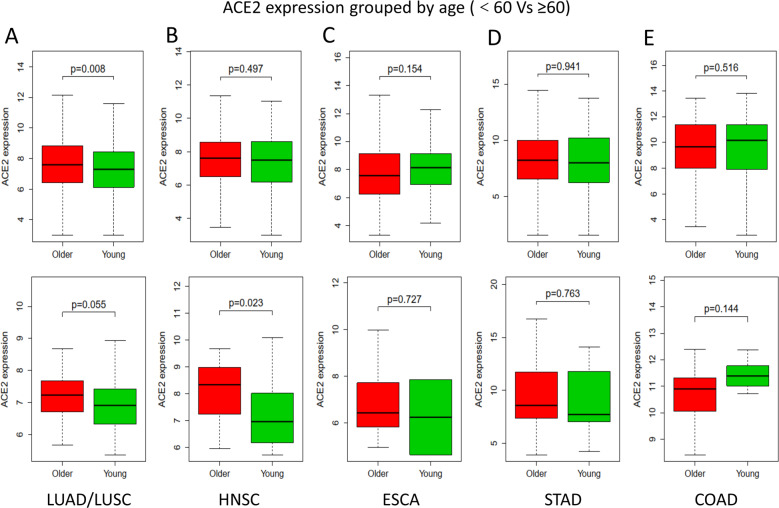
Fig. 2. The expression of ACE2 in different organs grouped by age.
a–e The expression of ACE2 in different tissues downloaded from TCGA database, grouped by age. Top row, the expression of ACE2 in tumor samples; Bottom row, the expression of ACE2 in NC samples. Bold black line, median value; dotted black line, range of values. Statistical tests: Mann–Whitney U-test. ACE2 angiotensin-converting enzyme 2, TCGA The Cancer Genome Atlas, NC healthy normal control, LUAD lung adenocarcinoma, LUSC lung squamous cell carcinoma, HNSC head and neck squamous cell carcinoma, ESCA esophageal carcinoma, STAD stomach adenocarcinoma, COAD colon adenocarcinoma.

