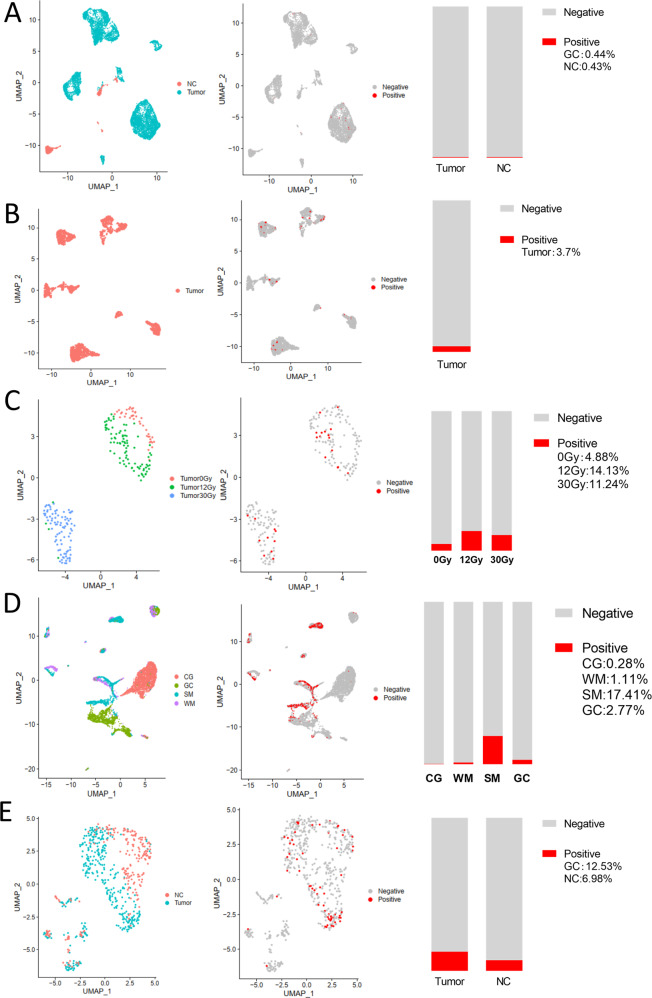
Fig. 4. Single-cell sequensing analysis of aerodigestive cancer cells.
a Single-cell analysis of lung cancer cells (tumor) in EXP0068 and NC cells in SRA878024. b Single-cell analysis of oral cancer cells in GSE103322. c Single-cell analysis of ESCC cell line KYSE-180 (tumor) treated with different doses of radiotherapy in GSE81812. d Single-cell analysis of CG, WM, SM, and GC cells in GSE134520. e Single-cell analysis of colon cancer cells (tumor) and NC cells in GSE81861. Left column, UMAP plots showing the distribution of cells, color-coded for pathology; middle column, UMAP plots showing the distribution of ACE2-positive cell (red); right column, Stacked barplot showing the proportion of ACE2-positive cells (red). EXP0068 was downloaded from the Cancer Single-cell State Atlas; SRA878024 was downloaded from the PanglaoDB; GSE103322, GSE81812, GSE134520, and GSE81861 were obtained from the Gene Expression Omnibus. NC healthy normal control, ESCC esophageal squamous cell carcinoma, CG chronic gastritis, WM wild intestinal metaplasia, SM severe intestinal metaplasia, GC gastric cancer, UMAP Uniform Manifold Approximation and Projection, ACE2 angiotensin-converting enzyme 2.

