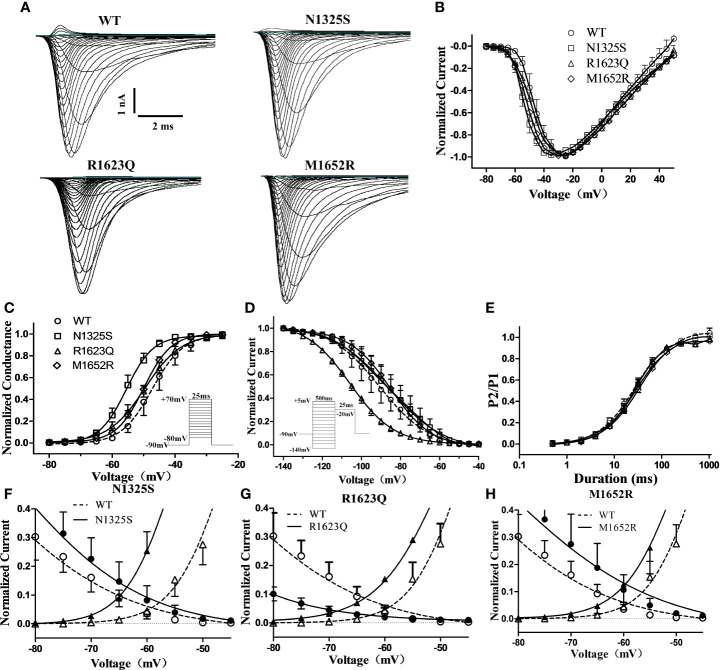
Figure 2.
Electrophysiological characterization of WT and mutant SCN5A channels’ peak sodium current. (A) Represent traces of sodium current of WT and mutant channels. (B) Normalized I–V relationships of WT and mutant channels. Steady-state activation (C) and inactivation (D) curves of peak sodium current were determined with the inset protocol and fitted with a Boltzmann. (E) Time course of recovery from inactivation was fitted with a bi-exponential function. (F–H) Overlapping of activation and inactivation curve enlarged to show the window current of peak sodium current of mutant channels.

